 加载中…
加载中…转贴:GOLD, A Case for the Bull
标签:
黄金市场大宗商品杂谈 |
分类: 黄金戒纸 |
实在没时间翻译!没耐心读文可直接读图!学习他的分析方法。
GOLD, A Case for the Bulls
Commodities / Gold & Silver 2009 Jun 23, 2009 - 10:11 AM
By: Alistair_Gilbert
The last year has seen some pretty dramatic falls in commodity prices but Gold actually managed to end 2008 as one of the best performing investments with a gain of about 5%. This was despite the fact that Gold normally rises inversely to the dollar and last year the dollar rose relentlessly, catching a lot of people off guard. This reinforced its reputation as a safe port when all around is chaos. This reputation has been garnered over 5,000 years, but during the boom stockmarket era of the 80s and 90s it lost a lot of its glitter as investors found better returns elsewhere.
http://www.marketoracle.co.uk/images/2009/June/gold-bulls-23_image002.jpgA
The stockmarket crash in 2000 awakened interest amongst investors and it has risen from $250 to $950 over the last ten years, outperforming most stockmarket investments. This may sound like a good performance, but it is only the start, as it has a lot of catching up to do.
2000年股票市场的下跌激发了一部分投资者对与黄金的兴趣,自那以后近十年,金价丛250美圆涨到950美圆一盎司,表现远远超过股票市场。看起来表现已经很不错,但实际上,着仅仅是开始,上涨仍将继续!
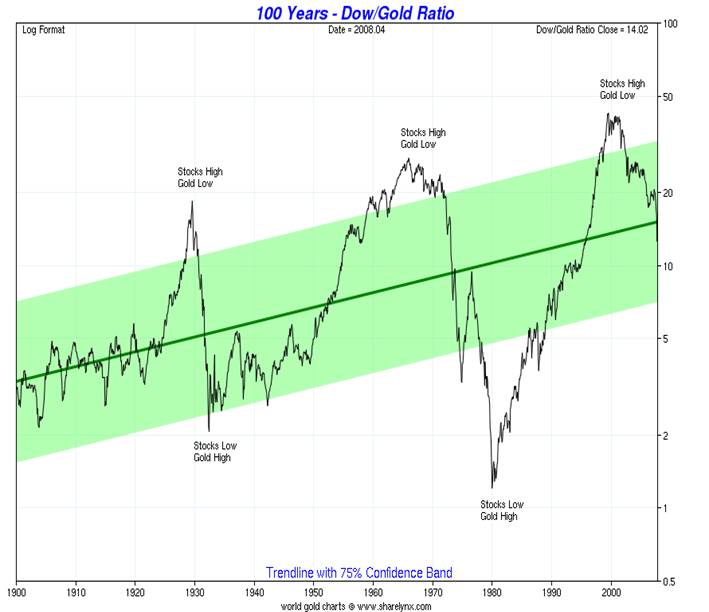
In January 1980, Gold stood at $850, but if we were to take into account inflation since 1980, it would need to be $2,300. If we go back to 1970 when the last Bull market started, and taking into account the inflation of the 70s, Gold would need to be $4,700 per ounce today. So, this is a minimum target that we can expect over the next 5 years, but what other corroborating evidence do we have that justifies this price (or an even higher price)? Well, if we look at the DOW/Gold ratio over the last 109 years we can see that there is a regular cycle which happens every 36 years and lasts about 14 years.
If we look at the pattern on this chart, it is known as a Megaphone pattern. This means that each high is higher and each low is lower and is a very bearish pattern. It is currently projecting down to about 0.6 from a current reading of about 9. This means that if the DOW were to stay static over the next 5 years, then Gold would go to $14,250!!! If the DOW were to drop to 2,000 (as may happen) then Gold would still rise to $3,562. The important thing to recognise is that Gold will significantly outperform the DOW over the next 5 years.
We still do not know how the “C” wave will play out in the DOW because whilst the “A” wave lasted two and a half years from March 2000 to October 2002, the “B” wave lasted five years, meaning that the “C” wave could last from two and a half years to four years if it conforms to normal parameters. Normal parameters are where the “C” wave is either equal in TIME to the “A” wave or 1.618 times (the next jump would be to 2.618 times but this is rare). At this moment I have labelled the DOW/S&P descent as three waves completing in March 2009 and that we are currently in wave 4 which will likely retrace 50% to the 1,050 level on the S&P by around late August this year. This is assuming my current wave count is correct. I have been told that Elliott Wave International believe that the March low was only the end of the first wave of “C” down which means that wave “C” will play out over the next 10 years or so!! Would Gold continue rising inversely to the market in those circumstances? Almost certainly not as the Gold Bull is already fairly mature at 10 years old and should only have a maximum four more years to complete.
In the middle of last year when I gave my long term Gold projections I thought that the Major Wave 2 correction would last into 2010 and take it back to $643 being the 50% retracement level. In the event, whilst Gold only retreated to $681 most other commodities had precipitous falls of around 75%, so I have assumed that Major wave 2 is complete and that we have started Major wave 3 up in October last year. Whilst this would be a short correction in TIME (7 months) by normal standards I have had to consider the fact that most other commodities saw corrections of 75% last year.
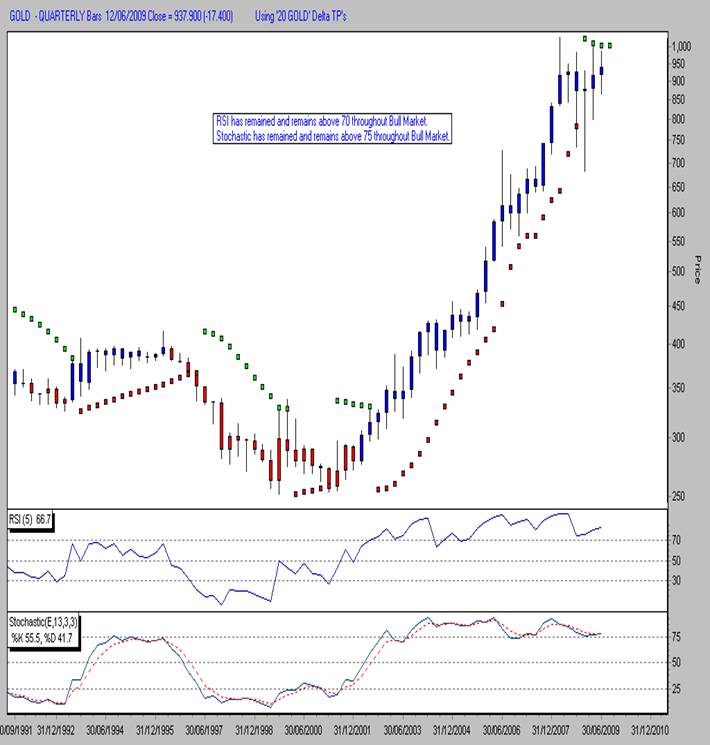
There are plenty of good fundamental reasons to be bullish on Gold, which I will come to later, but it is important to look at the charts to see what they are telling us. We will start with the quarterly chart to see the big picture as this encompasses the entire bull market to date. This is showing us that the bull market remains intact despite last year’s correction as the Relative Strength Indicator (RSI) has been above 70 since 2002 and remains above 70. Any breakdown below this level would warrant caution.
Also, if we look at the Stochastic, this has remained above the 75 level since 2002 also, even during the correction last year. One note of caution is with the Wilder Parabolic Indicator which went bearish in June last year and remains there until Gold moves above $1,012.
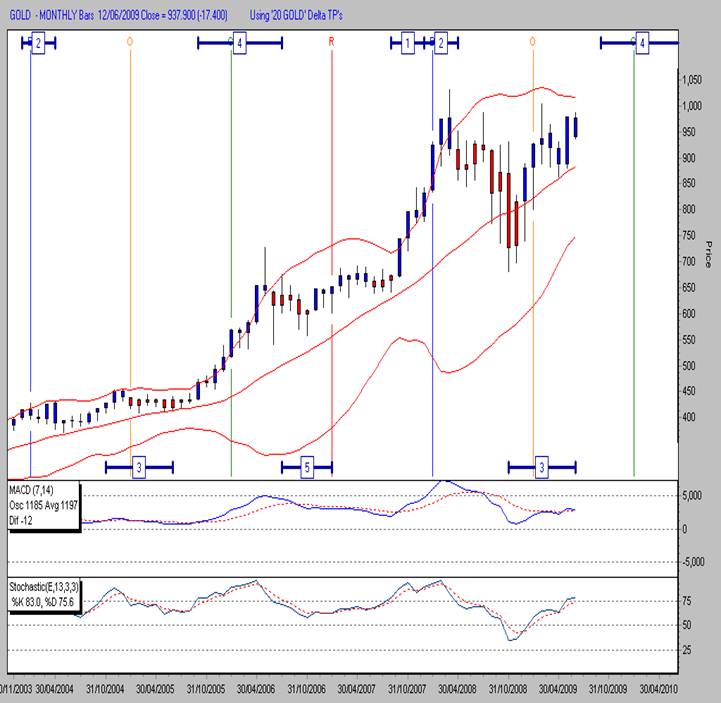
The next bullish evidence we have is on the Monthly Delta chart where the cycles are clearly mapped out for us by the Long Term Delta (LTD) points which have been very accurate with their time of arrival. LTD 3 low arrived in October last year and we are heading up to LTD 4 high which is not due until early next year. Whilst these indicators give us no guide to price, they are good at TIME.
Looking at the indicators, the MACD has remained above 0 throughout the Bull market and remains so. The Stochastic has just reached 83 which allows for a rise of about $300 before looking overbought. The interesting indicator here is the Bollinger Bands which are starting to pinch together in anticipation of a big move in about a month.
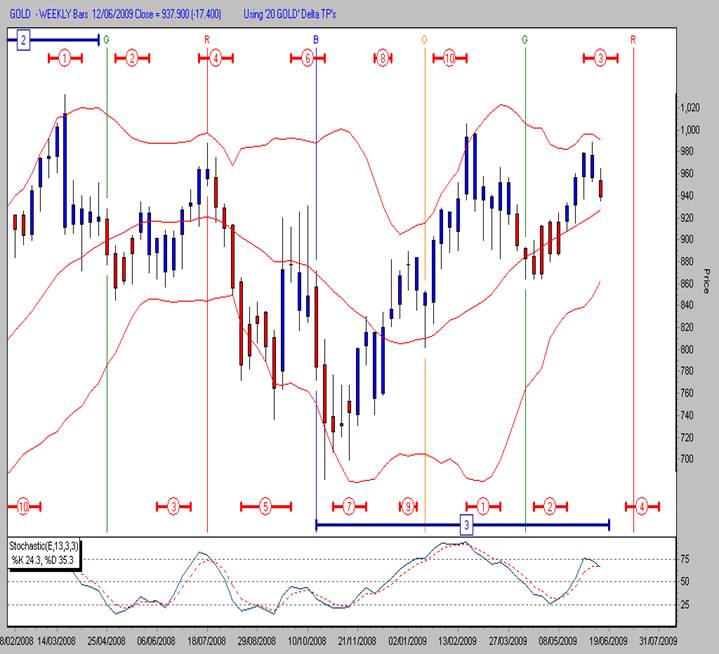
Moving closer in to the weekly chart, we can see that the Medium Term Delta high arrived on time and that we are heading down to MTD 4 low
http://www.marketoracle.co.uk/images/2009/June/gold-bulls-23_image006.jpgA
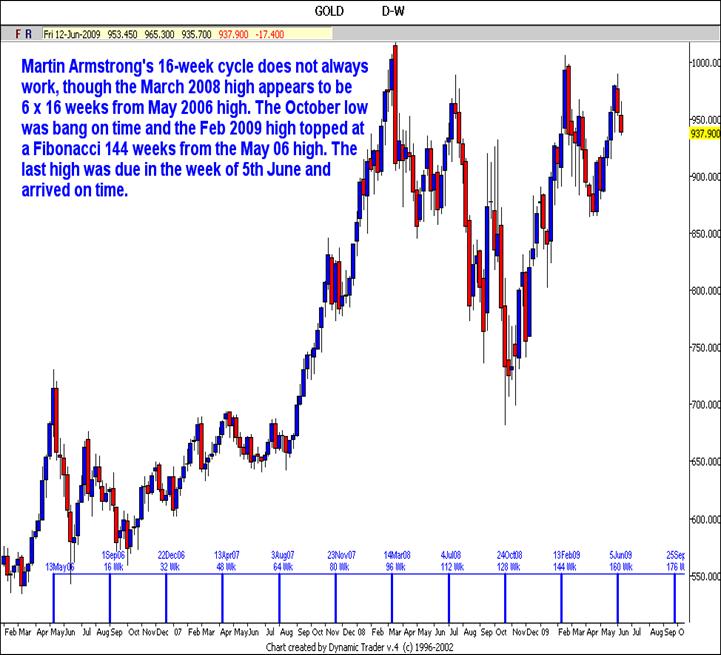
which is due 15th July, though I think it may well arrive a week early. The Stochastic reflects this and is pointing down, though it should not go below the 50 level. The top we have just had on 3rd June was also perfectly on time using the 16-week cycle first spotted by Martin Armstrong.
http://www.marketoracle.co.uk/images/2009/June/gold-bulls-23_image008.jpgA
This shows the top due in the week ending 5th June with the next one due in the week ending 25th September.
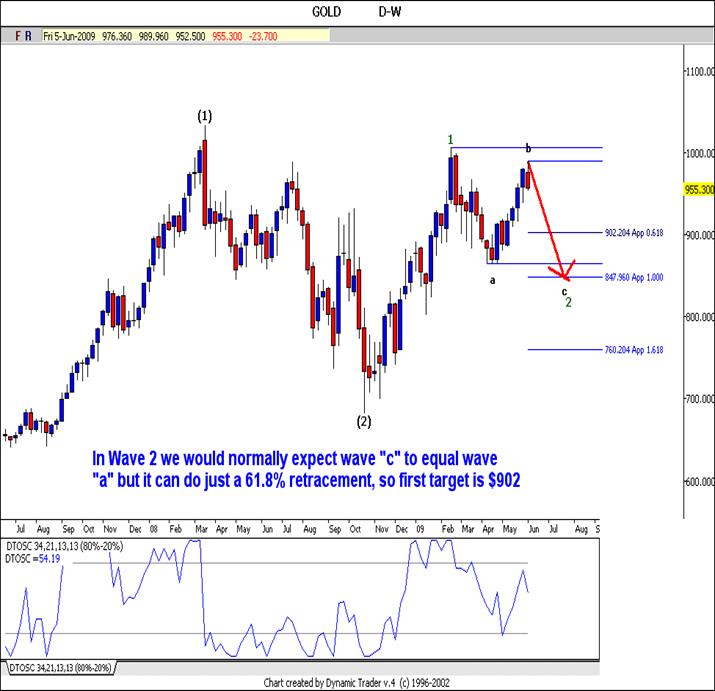
If we look at PRICE targets, it appears that we are in a “c” wave of wave 2 (of Major Wave 3). With a “c” wave in a Bull market it will probably only retrace 61.8% of the “a” wave, which gives us a downside target of $902
though the norm would be 100% for a “c” wave. Therefore if $902 is exceeded, we will be heading back to retest the 1980 closing high of $850 (with a target of $848).
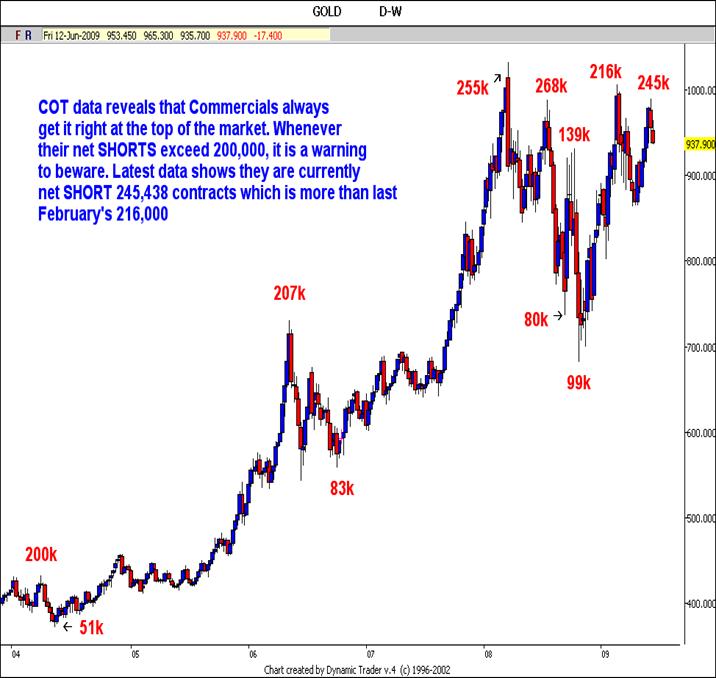
One further piece of evidence that we have that may be pointing to the $850 target is the Commitment of Traders (COT) report. Last week’s data shows that the large Commercial traders have increased their short
http://www.marketoracle.co.uk/images/2009/June/gold-bulls-23_image010.jpgA
positions to 245,000 contracts. This data is always a week in arrears and this high level is normally a prelude to a reasonable correction as is shown on the chart above. So we have now looked at the long-term technical analysis that confirms that the Gold Bull is still intact and the medium term which shows that we have a few weeks of downside.
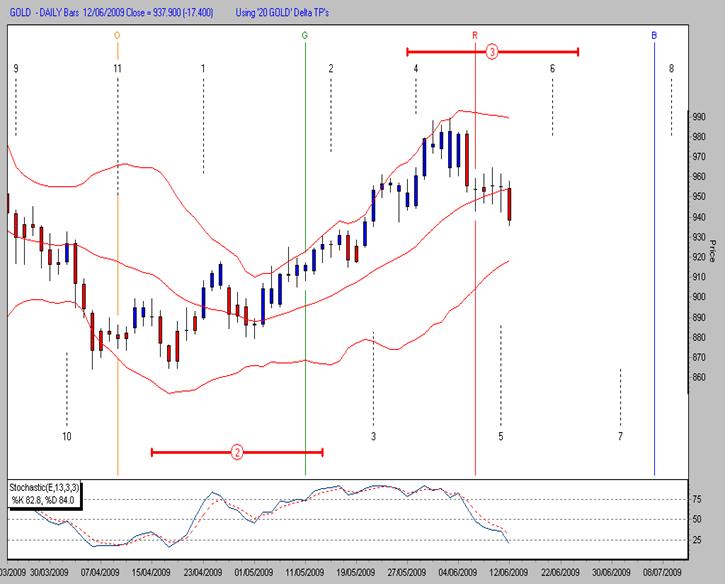
If we now zoom in on the short term for the traders amongst you, Gold should bottom in the next 24 hours, completing the “a” wave then bounce to around $960 in a “b” wave over the following week, before falling away into July to the $902 or possibly $850 levels.
The Stochastic is confirming this with a current reading of just 23.
http://www.marketoracle.co.uk/images/2009/June/gold-bulls-23_image012.jpgA
http://www.marketoracle.co.uk/images/2009/June/gold-bulls-23_image014.jpgA
However, there is plenty of fundamental analysis that confirms the bullish tone as well.
We heard recently that the Chinese have doubled their gold reserves over the last 5 years but this still only represents just over 1% of their total reserves and they are on record as saying that they wish to increase these to around 10%. In addition, I reproduce below two recent stories that you may not have seen, that show why gold is retaining its lustre.
http://www.marketoracle.co.uk/images/2009/June/gold-bulls-23_image016.jpgA
![]() 喜欢
喜欢
0
![]() 赠金笔
赠金笔