 加载中…
加载中…美股11个行业TOP10分红股票
标签:
财经股票美股新浪美股专栏 |
This report series was prompted by a Seeking Alpha reader request.
Since the fall of 2011 I've reported possible
buy
In response to both the Seeking Alpha reader request
and
These sectors were all subjected to screening based on a once per
year trading system triggered by yield,
Sector results based on first, YCharts yield data and, second,
Yahoo Finance historic price and dividend records, were compared
based on relative strengths of (1) yield and (2) dividend vs. price
gaps using projected annual dividends from $1,000
Abstracting all eleven sectors plus the Dow baseline index in one post delivered twelve currently undervalued stocks deemed by a quorum of analysts as showing significant upside price potential in addition to substantial dividend yield.
This effort responded to the overriding question, "which dividend
stocks were good, better, best, bad, or ugly, after January?" The
research was also in keeping with Yale
professor
Dog Metrics Selected Ten in Each Sector
Two key metrics determined the yields that ranked these sector dog stocks: (1) stock price; (2) annual dividend. Dividing the annual dividend by the price of the stock declared the percentage yield by which each dog stock was ranked.
Historically dividend dog investors utilized this ranking system to select portfolios of five or ten stocks in any one index, sector, or survey to trade. They awaited the results from their investments in the lowest priced, highest yielding stocks and prayed that the price of every stock they now owned climbed higher (having locked in a high yield percentage at purchase).
This Dogs of the Index strategy, popularized
by
Sector Synopses
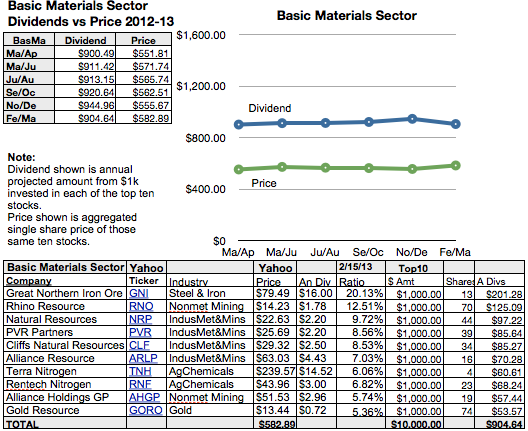
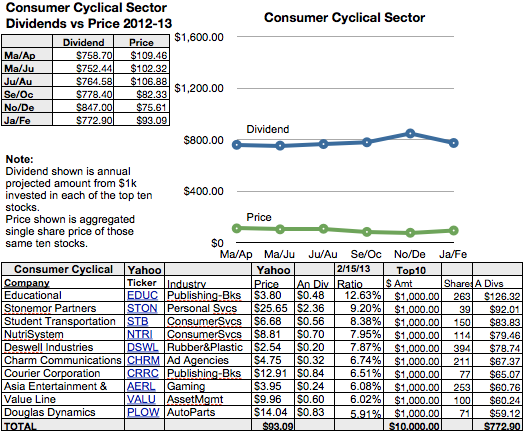
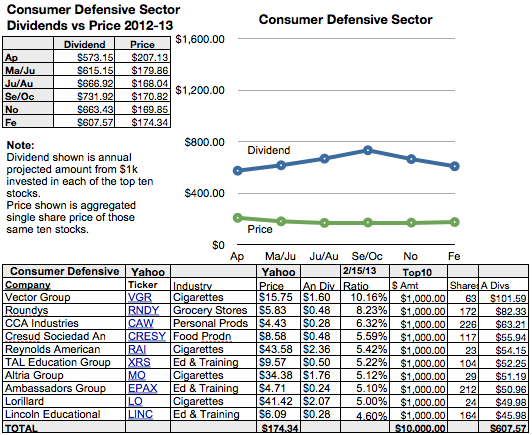
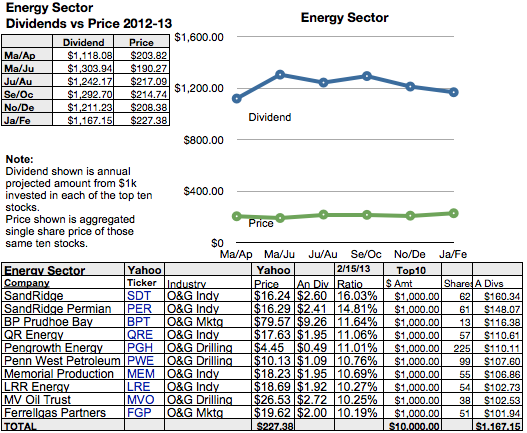
Ten dogs for each sector displayed their annual dividends from $1,000invested in those highest yielding stocks in the eleven sectors and one index compared to their aggregate single share prices to produce the summary graphs shown below:
Basic Materials Dividend Dogs
(click to enlarge)http://static.cdn-seekingalpha.com/uploads/2013/2/25/748328-1361841457314525-Fredrik-Arnold.png
The top basic materials stock paying the biggest dividend by yield
as of February 15 according to M/Y was Great Northern Iron
(GNI),
Communication Services Dividend Dogs
(click to enlarge)http://static.cdn-seekingalpha.com/uploads/2013/2/25/748328-1361841121229472-Fredrik-Arnold.png
Top ten communication services stocks showing the biggest dividend
yields per the M/Y screen as of February 15 represented five
industries.Tops
Consumer Cyclical Dividend Dogs
(click to enlarge)http://static.cdn-seekingalpha.com/uploads/2013/2/25/748328-13618410194789767-Fredrik-Arnold.png
Top ten consumer cyclical stocks showing the biggest dividend yields per the M/Y screen as of February 15 represented eight industries. Tops was one of two publishing-books firm listed, Educational Development Corporation (EDUC). The other book publisher, Courier Corporation (CRRC) was seventh. Second dog, StoneMor Partners (STON) was the lone representative from the personal services industry. Two top ten dogs from the consumer services industry took third and fourth, Student Transportation (STB), and NutriSystem (NTRI). One rubber and plasticsfirm listed in fifth, Deswell Industries (DSWL). An ad agency, Charm Communications, (CHRM) was sixth. Gaming firm, Asia Entertainment & Resources (AERL) was eighth. Publishing firm, Valueline (VALU) was ninth, and auto parts company, Douglas Dynamics (PLOW) was tenth.
Consumer Defensive Dividend Dogs
(click to enlarge)http://static.cdn-seekingalpha.com/uploads/2013/2/25/748328-13618408182038028-Fredrik-Arnold.png
Top ten consumer defensive stocks showing the biggest dividend yields per the M/Y screen as of February 15 represented five industries. Tops was one of four cigarettes firms listed, Vector Group (VGR). The other cigarettes firms placed fifth, seventh, and ninth, Reynolds American (RAI), Altria (MO), and Lorillard (LO). A chain of grocery stores took second (RNDY). CCA Industries (CAW), the only personal products firm listed was third. Then, Cresud Sociedad An (CRESY), a food production company as fourth. Finally, three education and training companies finished of the top ten consumer defensive dogs in sixth, eighth and tenth slots: TAL Education Group (XRS); Ambassadors Group (EPAX), and Lincoln Educational Services Corporation (LINC).
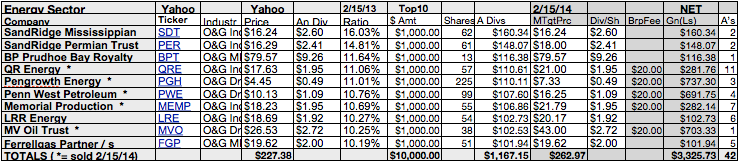
Energy Dividend Dogs
(click to enlarge)http://static.cdn-seekingalpha.com/uploads/2013/2/25/748328-1361840257229598-Fredrik-Arnold.png
The top ten energy stocks showing the biggest dividend yields as of February 15 according to Y/M screens all represented oil and gas industries: SandRidge Mississippian Trust I (SDT), an independent was top dog; SandRidge Permian Trust (PER), another independent was second dog; BP Prudhoe Bay Royalty Trust (BPT), a refiner and marketer was third; QR Energy (QRE), another independent was fourth; Pengrowth Energy (PGH), a driller, was the mid-dog of ten; Penn West Petroleum (PWE), another driller, was sixth dog; Memorial Production Partners (MEMP), an independent, was seventh; LRR Energy (LRE), the fifth independent on the list was eighth dog; MV Oil Trust (MVO), a third driller was ninth; finally, Ferrellgas Partners (FGP) the second refiner and marketer on this list, was the tenth M/Y dog.
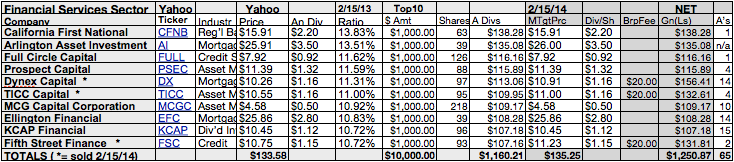
Financial Services Dividend Dogs
(click to enlarge)http://static.cdn-seekingalpha.com/uploads/2013/2/25/748328-1361839914616103-Fredrik-Arnold.png
Top ten financial services sector dogs showing the biggest dividend
yields by the M/Y screen after January represented seven
industries. Top financial services sector stock, California First
National Bancorp (CFNB) was the only regional bank listed. Second dog,
Arlington Asset Investment (AI), is on of
three mortgage investment firms on the list. Other mortgage
investors showed up in the fifth and eighth slots, Dynex Capital
(DX), and
Ellington Financial LLC (EFC). One of two
credit services firms was third on the list Full Circle Capital
(FULL).
Fifth Street Finance (FSC), the other credit services firm took tenth place.
One of three asset management firms in the top ten, Prospect
Capital Corporation (PSEC) was fourth. The other asset managers
were TICC Capital (TICC), in sixth, and MCG Capital Corporation
(MCGC)
in seventh. The ten financial services dogs for February were
completed by KCAP Financial (KCAP),
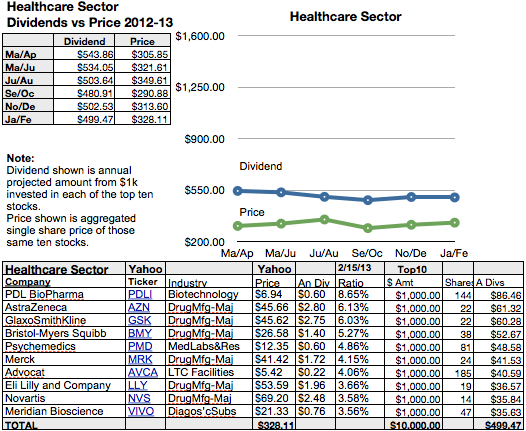
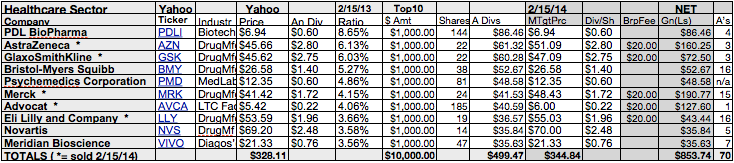
Healthcare Dividend Dogs
(click to enlarge)http://static.cdn-seekingalpha.com/uploads/2013/2/25/748328-136183970822444-Fredrik-Arnold.png
Five industries were represented by the ten healthcare sector stocks showing the biggest dividend yields as of February 15 by YCharts and Morningstar. Top healthcare sector stock PDL BioPharma (PDLI) was the only biotechnology firm in the top ten. AstraZeneca (AZN) in second position was one of six drug manufacturers, major on this list. Others were GlaxoSmithKline (GSK) in third, Bristol-Myers Squibb Company (BMY) in fourth, Merck (MRK) in sixth, Novartis AG (NVS) in eighth, and Eli Lilly and Company (LLY) in ninth,. Psychemedics Corporation (PMD), the fifth dog represented medical laboratories and research firms. Advocat (AVCA) providing long-term care facilities took seventh. Finally, Meridian Bioscience (VIVO) providing diagnostic substances took tenth and completed the top ten healthcare dogs.
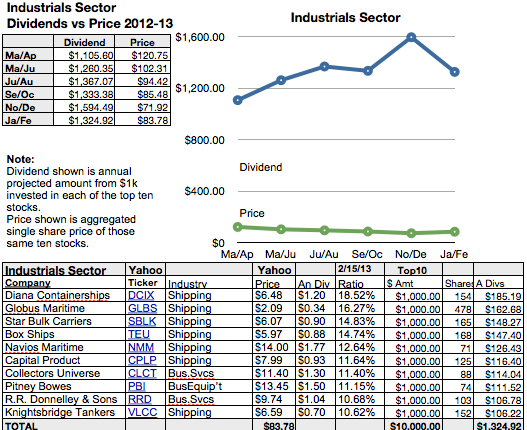
Industrials Dividend Dogs
(click to enlarge)http://static.cdn-seekingalpha.com/uploads/2013/2/25/748328-13618396008265958-Fredrik-Arnold.png
Ten industrials sector stocks showing the biggest M/Y screened dividend yields February 15 represented just three industries. Top industrials stock by dividend yield was one of seven stocks representing the shipping industry: Diana Containerships (DCIX). Other shippers were in second through sixth positions as well as tenth: Globus Maritime (GLBS); Star Bulk Carriers (SBLK); Box Ships (TEU); Navios Maritime Partners (NMM); Capital Product Partners (CPLP); Knightsbridge Tankers (VLCCF). Business services firms took seventh and ninth places, Collectors Universe (CLCT), and R.R. Donnelley & Sons (RRD). Pitney Bowes in business services took eighth place to complete the top ten industrials dogs.
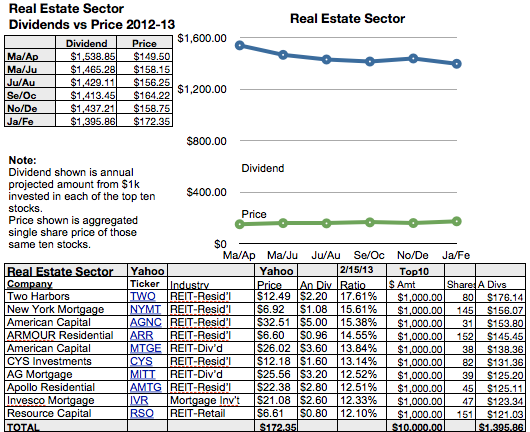
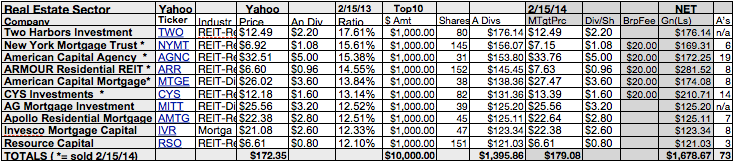
Real Estate Dividend Dogs
(click to enlarge)http://static.cdn-seekingalpha.com/uploads/2013/2/25/748328-13618392663350923-Fredrik-Arnold.png
Top ten real estate sector dogs showing the biggest dividend yields
by Y/M's screen after January represented four industries. Top real
estate sector stock, Two Harbors Investment
(TWO),
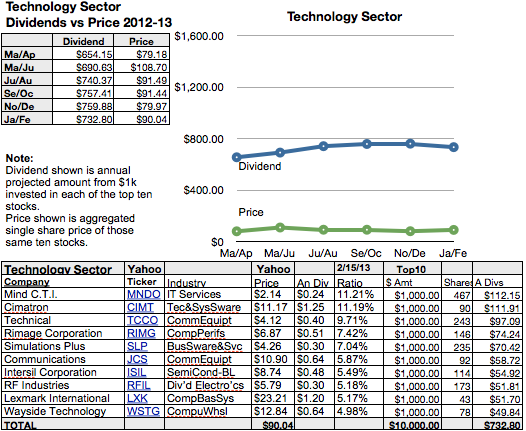
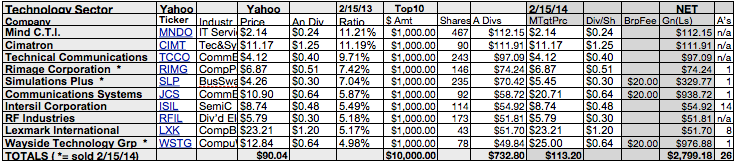
Technology Dividend Dogs
(click to enlarge)http://static.cdn-seekingalpha.com/uploads/2013/2/25/748328-13618385492031674-Fredrik-Arnold.png
Top ten technology sector stocks from Yahoo Finance screening
showing the biggest dividend yields February 5 represented ten
industries. Top technology sector stock was Mind C.T.I. (MNDO)
representing information technology services. Second techno dog,
Cimatron (CIMT) represented technical and system software. Technical
Communications Corporation (TCCO) a communication equipment firm
took third place. Rimage Corporation (RIMG) a computer peripherals
firm, took fourth. Simulations Plus (SLP) the number five techno
dog represented business software and services. Communications
Systems (JCS) represented communications equipment firms in sixth
place. Seventh techno dog, Intersil Corporation (ISIL)
represented semiconductors-broad line. RF Industries (RFIL) a
diversified electronics firm was eighth. Lexmark International a
computer based systems firm was ninth. Finally, in tenth place was
United
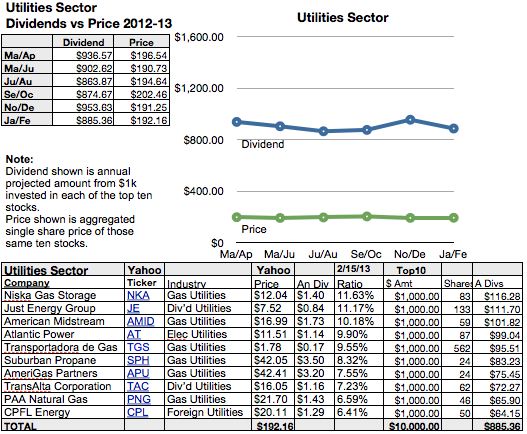
Utilities Dividend Dogs
(click to enlarge)http://static.cdn-seekingalpha.com/uploads/2013/2/25/748328-13618381799620898-Fredrik-Arnold.png
The top ten utilities sector stocks showing the biggest dividend yields February 15 by Y/M represented four industries: electric; gas; diversified; foreign. Top dog, Niska Gas Storage Partners (NKA) was one of six gas utilities. The other gas firms were in third, fifth, sixth, seventh, and ninth places: American Midstream Partners (AMID); Transportadora de Gas del Sur (TGS); Suburban Propane Partners (SPH); Amerigas Partners (APU); PAA Natural Gas Storage (PNG). Second place went to one of two diversified utilities firms, Just Energy Group (JE). The other diversified utility, TransAlta Corporation (TAC) was eighth. Atlantic Power Corporation (AT) the fourth utilities dog was the lone electric firm listed. One foreign utility, CPFL Energia (CPL) was listed tenth.
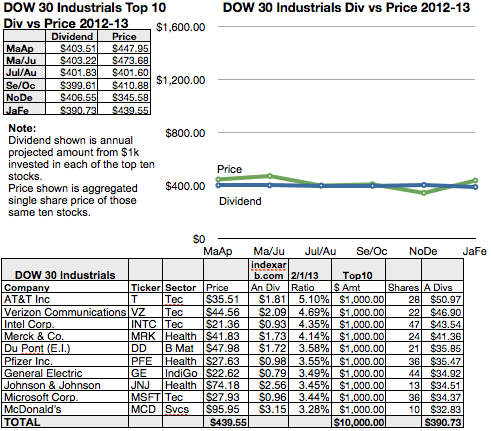
Dow Industrial Dividend Dogs
(click to enlarge)http://static.cdn-seekingalpha.com/uploads/2013/2/25/748328-13618377948221972-Fredrik-Arnold.png
Three of four technology firms led the Dow top ten showing the
biggest dividend yields as of February 1, according
to
All Together Now
Each graph below shows six points of comparison between annual projected dividends resulting from $10,000 invested as $1,000 each in the top ten high yield stocks (blue points) versus the total prices of one share of each of the ten stocks (green points). Grouped together the graphs display comparative gyrations of eight sectors and the Dow index as of February.
(click to enlarge)http://static.cdn-seekingalpha.com/uploads/2013/2/25/748328-1361837668432044-Fredrik-Arnold(click to enlarge)http://static.cdn-seekingalpha.com/uploads/2013/2/25/748328-13618376228400428-Fredrik-Arnold(click to enlarge)http://static.cdn-seekingalpha.com/uploads/2013/2/25/748328-13618375485649188-Fredrik-Arnold(click to enlarge)http://static.cdn-seekingalpha.com/uploads/2013/2/25/748328-13618375151067057-Fredrik-Arnold
Sector Dogs Vie for Dividend Dominance
The following graph shows annual dividends projected from $1,000invested in each of ten stocks with the top yields in the eleven M/Y sectors compared to those of the Dow. The chart plotted projected yields as of six purchase points since March. Generally, projected yields increased in the sectors when average stock prices fell. When prices escalated yields dropped.
Relative yield strengths differentiated the sectors. The Dow baseline showed the lowest overall yield with a low flat trajectory down 3% since March 2012. Healthcare dividend yield was also down by 8% for the year; consumer defensive yield was up 6% overall despite falling 17% since October; technology yield increased 12% since March; consumer cyclical yield was up 2% for the year; utilities yield fell 5%; basic materials yield was up .5%; communications services sector vectored up 11% by yield for the year; financial services yields, however, were down 11%; energy yields were up 4% annually; industrials yields soared 20% for the year; meanwhile, real estate yields tumbled 9%.
Annual Dividends Forecast from $1k
Invested in each of 10 Top Yielding Stocks in 11 Sectors
and the
(click to enlarge)http://static.cdn-seekingalpha.com/uploads/2013/2/25/748328-13618374474140854-Fredrik-Arnold.png
Relative Risk of Dogs by Sector Revealed by Dividend vs. Price Divergence
A reader request to "add relative financial data on the companies
selected" for a previous article comparing indices by annual yield
projections has inspired a simple tool to gauge investment risk.
The tool is best applied prior to the purchase of any 5 or
10
Dogfight for Dividend Dominance Disclosed
To show risk, the gap between annual projected dividend (resulting from $10,000 invested as $1,000 each in the top ten highest yielding stocks) was compared to the aggregate price of one share each of those ten stocks in that same index or sector. These twelve representative market sectors and index displayed their relative divergence of dividend vs. price in the following order:
(click to enlarge)http://static.cdn-seekingalpha.com/uploads/2013/2/25/748328-13618373899415562-Fredrik-Arnold.png
The industrials sector ran away with top risk status in February as
it leaped to 1481.43% of dividend divergence projected from $1000
invested in each of
its top
Actionable Conclusion: Analysts
Forecast
Charts below for each sector show comparative net gains as of
February 15,
Three to five dogs from each index were selected as sells based on highest net gain. The hypothetical sale of those stocks added to the projected dividends revealed the total net for each sector. Since $10k is the initial investment, the percentage net gain is easy to calculate for each.
The number of analysts contributing to the mean target price estimate for each stock is noted in the last column on the charts. Three to nine analysts is considered optimal for a higher probability projection estimate.
Energy Sector Analysts See Over 33% Net Gains
(click to enlarge)http://static.cdn-seekingalpha.com/uploads/2013/2/25/748328-1361837337675144-Fredrik-Arnold.png
Technology Analysts See Near 28% Net Gains
(click to enlarge)http://static.cdn-seekingalpha.com/uploads/2013/2/25/748328-1361837300094011-Fredrik-Arnold.png
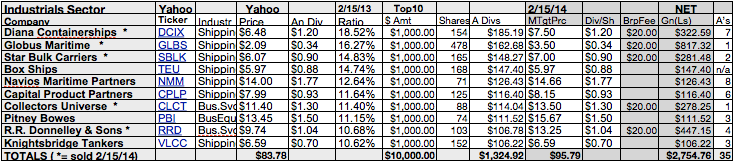
Industrials Sector Analysts See Over 27.5% Net Gains
(click to enlarge)http://static.cdn-seekingalpha.com/uploads/2013/2/25/748328-13618372703920107-Fredrik-Arnold.png
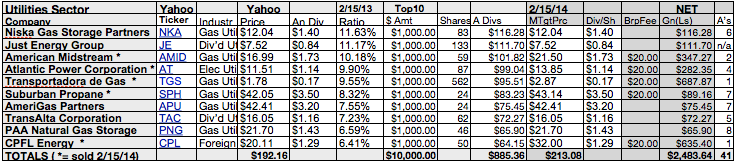
Utilities Sector Analysts See Near 25% Net Gains
(click to enlarge)http://static.cdn-seekingalpha.com/uploads/2013/2/25/748328-1361837246463044-Fredrik-Arnold.png
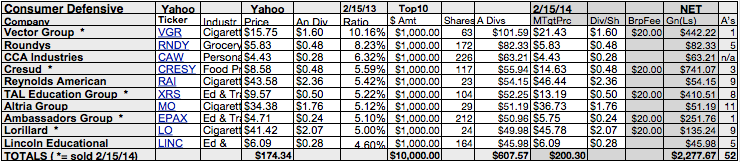
Consumer Defensive Sector Analysts See Near 23% Net Gains
(click to enlarge)http://static.cdn-seekingalpha.com/uploads/2013/2/25/748328-13618371294382591-Fredrik-Arnold.png
Consumer Cyclical Analysts See Over 20% Net Gains
(click to enlarge)http://static.cdn-seekingalpha.com/uploads/2013/2/25/748328-13618370759529886-Fredrik-Arnold.png
Basic Materials Sector Analysts See Near 20% Net Gains
(click to enlarge)http://static.cdn-seekingalpha.com/uploads/2013/2/25/748328-13618370374930992-Fredrik-Arnold.png
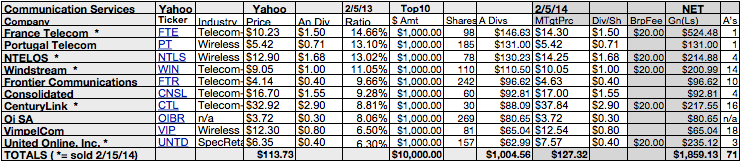
Communications Services Analysts See Over 18% Net Gains
(click to enlarge)http://static.cdn-seekingalpha.com/uploads/2013/2/25/748328-1361837011069262-Fredrik-Arnold.png
Real Estate Sector Analysts See Near 14% Net Gains
(click to enlarge)http://static.cdn-seekingalpha.com/uploads/2013/2/25/748328-13618369856606507-Fredrik-Arnold.png
Financial Sector Analysts See Over 12.5% Net Gains
(click to enlarge)http://static.cdn-seekingalpha.com/uploads/2013/2/25/748328-13618369487193155-Fredrik-Arnold.png
Healthcare Sector Analysts See Over 8.5% Net Gains
(click to enlarge)http://static.cdn-seekingalpha.com/uploads/2013/2/25/748328-13618369163761458-Fredrik-Arnold.png
Actionable
Top ten dogs powering each of these eight sector components were
graphed below to show relative strengths by price upside estimates
between February 15,
This graph of upside price potential shows positive price gains for each sector and the Dow ranging from 1.25% for the ten financial sector dogs to 25.72% for the ten technology sector dogs.
http://static.cdn-seekingalpha.com/uploads/2013/2/25/748328-13618368725550258-Fredrik-Arnold.png
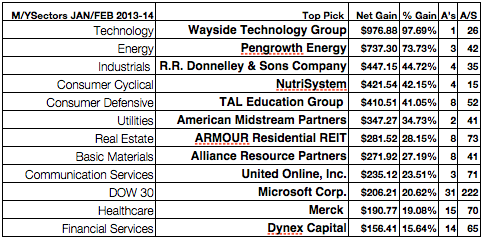
Some Profit Generating Sector Dog Trades
These profit generating dog trades one year from now were revealed by analysts mean target prices for each of eight sectors. The list below is summarized from Yahoo Finance data. The opportunities listed are based on each sector's best mean target price for 2014 determined by one to thirty-one analysts.
Wayside Technology Group (WSTG) in the technology sector was named to net a 97.69% annual gain based on mean target pricing set by 1 analyst. (Top ten technology dogs were reviewed a total of 28 analysts for an average of 3 analysts per stock.)
Pengrowth Energy from the energy sector netted a 73.73% price gain based on a mean target price determined by 3 analysts. (Top ten energy dogs were reviewed a total of 42 analysts for an average of 4 analysts per stock.)
R.R. Donnelley & Sons from the industrials sector was projected to net a 73.73% net gain based on a mean target price set by 4 analysts. (Top ten industrials dogs were reviewed by a total of 35 analysts for an average of 4 analysts per stock.)
NutriSystem from consumer cyclicals was projected to net a 42.15% price gain based on mean target price determined by 4 analysts. (Top ten consumer goods dogs were reviewed a total of 15 analysts for an average of 2 analysts per stock.)
TAL Education Group in the consumer defensive sector was projected to net a 41.05% price gain based on mean target price determined by 8 analysts. (Top ten consumer goods dogs were reviewed a total of 52 analysts for an average of 5 analysts per stock.)
American Midstream Partners from the utilities sector was seen to net 34.73% for the next year based on a mean target price set by 2 analysts. (Top ten utilities dogs were reviewed a total of 41 analysts for an average of 4 analysts per stock.)
ARMOUR Residential REIT from real estate was estimated to show a net price gain of 28.15% based on a mean target price set by 8 analysts. (Top ten real estate dogs were reviewed a total of 73 analysts for an average of 7 analysts per stock.)
Alliance Resource Partners from basic materials netted a 27.19% price gain based on a mean target price determined by 8 analysts. (Top ten basic materials dogs were reviewed a total of 41 analysts for an average of 4 analysts per stock.)
United Online, Inc. from communication services was projected to net a 23.51% price gain based on mean target price determined by 3 analysts. (Top ten communication services dogs were reviewed a total of 71 analysts for an average of 7 analysts per stock.)
Microsoft Corp. from the Dow Industrials Index was determined to net a 20.62% price gain based on a mean target price set by 31 analysts. (Top ten Dow dogs were reviewed a total of 222 analysts for an average of 22 analysts per stock.)
Merck & Company from healthcare was determined to net a 19.08% price gain based on a mean target price set by 15 analysts. (Top ten healthcare dogs were reviewed a total of 70 analysts for an average of 7 analysts per stock.)
Dynex Capital from financial services showed a 15.64% net gain based on a mean target price set by 14 analysts. (Top ten financial services dogs were reviewed a total of 65 analysts for an average of 7 analysts per stock.)
(click to enlarge)http://static.cdn-seekingalpha.com/uploads/2013/2/25/748328-1361836829737015-Fredrik-Arnold.png
These Morningstar/YCharts sectors and their component stocks have ongoing stories to tell. These graphs, charts, and lists of companies will be updated again for publication periodically.
Disclaimer:
![]() 喜欢
喜欢
0
![]() 赠金笔
赠金笔