 加载中…
加载中…Market Profile (市场功能 MT4 MT5指标)[MT5公式]
标签:
杂谈 |
适用于MetaTrader 4和MetaTrader 5平台。
Market Profile MT4 MT5 指标 — 是一种经典的市场概况执行指标,可显示价格的密集程度,描述日交易时段最重要的价格水平,值域以及控制值。该指标可附加到5分钟、15分钟和30分钟图表,可显示日交易时段的市场概况。虽然5分钟时间框架的精确性更高,但由于30分钟时间框架具有更高的可视性,故推荐使用30分钟的时间框架。该指标有3种颜色组合可用于描绘市场阻力。该指标基于纯粹的价格行为,不使用任何标准MetaTrader指标。
输入参数:
StartFromDate (默认 = '') — 如果StartFromToday设置为false,那么该指标将从此日期描绘市场概况。它往回进行描绘。例如,如果您设置为2010.07.20,DaysToCount设置为2,那么它会描绘2010.07.20和2010.07.19的市场概况。
StartFromToday (默认 = true) — 如果设置为true,那么该指标将从今日开始描绘,否侧将从StartFromDate设置的日期开始。
DaysToCount (默认 = 2) — 指描绘市场概况的天数。
ColorScheme (默认 = 0) — c市场概况阻力的颜色组合:
0 — 蓝色到红色.
1 — 红色到绿色.
2 — 绿色到蓝色.
MedianColor (默认 = White) — 控制值(中值)的颜色。
ValueAreaColor (默认 = White) — 值域边界的颜色。
http://www.cxh99.com/UploadFiles/Article2/2012/5/201205131612542433.pngProfile
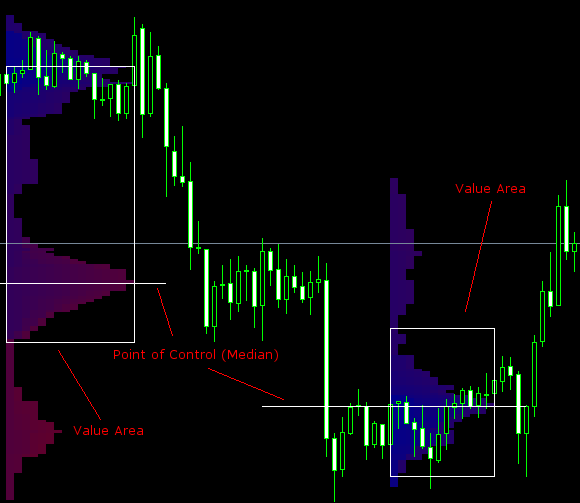
图表屏幕显示了2日外汇交易时段计算得出的市场概况。时间框架为30分钟图表,第二日仍在进行当中。最早的价格标记为蓝色,最后的价格为红色。中值和值域使用白线标记,并显示最重要的价格区域。如果突破行为的交易量不够大,交易商更倾向于返回那些区域。以高交易量突破这些区域意味着真实的突破。了解更多关于市场概况的内容,请查阅此简短的电子书:市场概况书籍。
标签:MT4 MT5指标源码
MT4 指标源码
//+------------------------------------------------------------------+
//|
MarketProfile.mq4 |
//|
Copyright � 2010, EarnForex.com |
//|
http://www.cxh99.com/ |
//+------------------------------------------------------------------+
#property copyright
"www.cxh99.com"
#property
link
"www.cxh99.com"
#property indicator_chart_window
extern datetime StartFromDate = D'';
extern
bool
StartFromToday = true;
extern
int
DaysToCount =
2; // Number of days for which to count the Market Profile
extern
int
ColorScheme
= 0; // 0 - Blue to Red, 1 - Red to Green, 2 - Green to Blue
extern
color
MedianColor
= White;
extern
color
ValueAreaColor = White;
int
DigitsM;
// Amount of digits normalized for standard 4 and 2 digits after
dot
datetime
StartDate;
// Will hold either StartFromDate or Time[0]
double
onetick;
// One normalized pip
int
SecondsInPeriod;
// Will hold calculated amount of seconds in the selected timeframe
period
bool FirstRunDone = false; // If true - OnCalculate() was already
executed once
//+------------------------------------------------------------------+
//| Custom indicator initialization
function
|
//+------------------------------------------------------------------+
int init()
{
IndicatorShortName("MarketProfile");
//
Normalizing the digits to standard 4- and 2-digit quotes
if (Digits
== 5) DigitsM = 4;
else if
(Digits == 3) DigitsM = 2;
else DigitsM
= Digits;
if
(Period() == PERIOD_M30) SecondsInPeriod = 1800;
if (Period()
== PERIOD_M15) SecondsInPeriod = 900;
if (Period()
== PERIOD_M5) SecondsInPeriod = 300;
onetick =
NormalizeDouble(1 / (MathPow(10, DigitsM)), DigitsM);
}
//+------------------------------------------------------------------+
//| Custor indicator deinitialization
function
|
//+------------------------------------------------------------------+
int deinit()
{
// Delete
all rectangles (it takes too much time to delete exactly those
rectangles that were created by this indicator)
ObjectsDeleteAll(0, OBJ_RECTANGLE);
}
//+------------------------------------------------------------------+
//| Custom Market Profile main iteration
function
|
//+------------------------------------------------------------------+
int start()
{
if
((Period() != PERIOD_M30) &&
(Period() != PERIOD_M15) &&
(Period() != PERIOD_M5))
{
Print("TimeFrame should be set to M30, M15 or
M5.");
return(-1);
}
if
(StartFromToday) StartDate = Time[0];
else
StartDate = StartFromDate;
// If we
calculate profiles for the past days, no need to rerun it
if
((FirstRunDone) && (StartDate !=
Time[0])) return(0);
// Get
start and end bar numbers of the given date
int dayend =
FindDayEndByDate(StartDate);
int daystart
= FindDayStart(dayend);
int
DayToStart = 0;
// If all
days have already been counted, jump to the current one
if
(FirstRunDone) DayToStart = DaysToCount - 1;
else
{
// Move back to the oldest day to count to start from it
for (int i = 1; i < DaysToCount; i++)
{
dayend = daystart + 1;
daystart = FindDayStart(dayend);
}
}
// We
begin from the oldest day coming to today or to StartFromDate
for (i =
DayToStart; i < DaysToCount; i++)
{
double DayMax = -1, DayMin = 99999999999;
// Find the day's high and low to
for (int bar = daystart; bar >= dayend; bar--)
{
if (High[bar] > DayMax) DayMax = High[bar];
if (Low[bar] < DayMin) DayMin = Low[bar];
}
DayMax = NormalizeDouble(DayMax, DigitsM);
DayMin = NormalizeDouble(DayMin, DigitsM);
int TPOperPrice[];
// Possible price levels if multiplied to integer
int max = MathRound(DayMax / onetick + 2); // + 2 because further
we will be possibly checking array at DayMax + 1
ArrayResize(TPOperPrice, max);
ArrayInitialize(TPOperPrice, 0);
int MaxRange = 0; // Maximum distance from day start to the drawn
dot
double PriceOfMaxRange = 0; // Level of the maximum range, required
to draw Median
double DistanceToCenter = 99999999; // Closest distance to center
for the Median
int TotalTPO = 0; // Total amount of dots (TPO's)
// Going through all possible quotes from daily High to daily
Low
for (double price = DayMax; price >= DayMin; price
-= onetick)
{
int range = 0; // Distance from first bar to the current bar
// Going through all bars of the day to see if the price was
encoutered here
for (bar = daystart; bar >= dayend; bar--)
{
// Price is encountered in the given bar
if ((price >= Low[bar])
&& (price <=
High[bar]))
{
// Update maximum distance from day's start to the found bar
(needed for Median)
if ((MaxRange < range) || ((MaxRange == range)
&& (MathAbs(price - (DayMin +
(DayMax - DayMin) / 2)) < DistanceToCenter)))
{
MaxRange = range;
PriceOfMaxRange = price;
DistanceToCenter = MathAbs(price - (DayMin + (DayMax - DayMin) /
2));
}
// Draws rectangle
PutDot(price, Time[daystart], range, bar - daystart);
// Remember the number of encountered bars for this bars
int index = MathRound(price / onetick);
TPOperPrice[index]++;
range++;
TotalTPO++;
}
}
}
double TotalTPOdouble = TotalTPO;
// Calculate amount of TPO's in the Value Area
int ValueControlTPO = MathRound(TotalTPOdouble * 0.7);
// Start with the TPO's of the Median
index = PriceOfMaxRange / onetick;
int TPOcount = TPOperPrice[index];
// Go through the price levels above and below median adding the
biggest to TPO count until the 70% of TPOs are inside the Value
Area
int up_offset = 1;
int down_offset = 1;
while (TPOcount < ValueControlTPO)
{
double abovePrice = PriceOfMaxRange + up_offset * onetick;
double belowPrice = PriceOfMaxRange - down_offset * onetick;
// If belowPrice is out of the day's range then we should add only
abovePrice's TPO's, and vice versa
index = MathRound(abovePrice / onetick);
int index2 = MathRound(belowPrice / onetick);
if (((TPOperPrice[index] >= TPOperPrice[index2]) ||
(belowPrice < DayMin))
&& (abovePrice <=
DayMax))
{
TPOcount += TPOperPrice[index];
up_offset++;
}
else
{
TPOcount += TPOperPrice[index2];
down_offset++;
}
}
string LastName = " " +
TimeToStr(Time[daystart], TIME_DATE);
// Delete old Median
if (ObjectFind("Median" +
LastName) >= 0)
ObjectDelete("Median " +
LastName);
// Draw a new one
index = MathMax(daystart - MaxRange - 5, 0);
ObjectCreate("Median" + LastName,
OBJ_RECTANGLE, 0, Time[daystart + 16], PriceOfMaxRange,
Time[index], PriceOfMaxRange + onetick);
ObjectSet("Median" + LastName,
OBJPROP_COLOR, MedianColor);
ObjectSet("Median" + LastName,
OBJPROP_STYLE, STYLE_SOLID);
ObjectSet("Median" + LastName,
OBJPROP_BACK, false);
// Delete old Value Area
if (ObjectFind("Value Area" +
LastName) >= 0) ObjectDelete("Value
Area " + LastName);
// Draw a new one
ObjectCreate("Value Area" +
LastName, OBJ_RECTANGLE, 0, Time[daystart], PriceOfMaxRange +
up_offset * onetick, Time[daystart] + (MaxRange + 1) *
SecondsInPeriod, PriceOfMaxRange - down_offset * onetick);
ObjectSet("Value Area" +
LastName, OBJPROP_COLOR, ValueAreaColor);
ObjectSet("Value Area" +
LastName, OBJPROP_STYLE, STYLE_SOLID);
ObjectSet("Value Area" +
LastName, OBJPROP_BACK, false);
// Go to the newer day only if there is one or more left
if (DaysToCount - i > 1)
{
daystart = dayend - 1;
dayend = FindDayEndByDate(Time[daystart]);
}
}
FirstRunDone
= true;
return(0);
}
//+------------------------------------------------------------------+
//| Finds the day's starting bar number for any given bar
number.
|
//| n - bar number for which to find starting
bar.
|
//+------------------------------------------------------------------+
int FindDayStart(int n)
{
int x =
n;
while
((TimeDayOfYear(Time[n]) == TimeDayOfYear(Time[x]))
&& (x < Bars))
x++;
return(x
- 1);
}
//+------------------------------------------------------------------+
//| Finds the day's end bar by the day's
date.
|
//+------------------------------------------------------------------+
int FindDayEndByDate(datetime date)
{
int x =
0;
while
((TimeDayOfYear(date) < TimeDayOfYear(Time[x]))
&& (x < Bars))
x++;
return(x);
}
//+------------------------------------------------------------------+
//| Puts a dot (rectangle) at a given position and
color.
|
//| price and time are
coordinates.
|
//| range is for the second
coordinate.
|
//| bar is to determine the color of the
dot.
|
//+------------------------------------------------------------------+
void PutDot(double price, datetime time, int range, int bar)
{
string
LastName = " " + (time + range *
SecondsInPeriod) + " " +
DoubleToStr(price, 4);
if
(ObjectFind("MP" + LastName)
>= 0) return;
ObjectCreate("MP" + LastName,
OBJ_RECTANGLE, 0, time + range * SecondsInPeriod, price, time +
(range + 1) * SecondsInPeriod, price + onetick);
// Color
switching depending on the distance of the bar from the day's
beginning
int colour,
offset1, offset2;
switch(ColorScheme)
{
case 0:
colour = DarkBlue;
offset1 = 0x020000;
offset2 = 0x000002;
break;
case 1:
colour = DarkRed;
offset1 = 0x000002;
offset2 = 0x000200;
break;
case 2:
colour = DarkGreen;
offset1 = 0x000200;
offset2 = 0x020000;
break;
}
if (Period()
== PERIOD_M30) colour += bar * offset1;
else if
(Period() == PERIOD_M15) colour += bar * (offset1 / 2);
else colour
+= (bar / 3) * (offset1 / 2);
if (Period()
== PERIOD_M30) colour -= bar * offset2;
else if
(Period() == PERIOD_M15) colour -= bar * (offset2 / 2);
else colour
-= (bar / 3) * (offset2 / 2);
ObjectSet("MP" + LastName,
OBJPROP_COLOR, colour);
// Fills
rectangle
ObjectSet("MP" + LastName,
OBJPROP_BACK, true);
}
//+------------------------------------------------------------------+
MT5指标源码
//+------------------------------------------------------------------+
//|
MarketProfile.mq5 |
//|
Copyright � 2010, EarnForex.com |
//|
http://www.cxh99.com/ |
//+------------------------------------------------------------------+
#property copyright
"www.cxh99.com"
#property
link
"http://www.cxh99.com"
#property version
"1.01"
#property description "Displays the Market
Profile indicator for the daily trading
sessions."
#property description "Should be attached to M5,
M15 or M30 timeframes."
#property description "M30 is
recommended."
#property description ""
#property description "Designed for standard
currency pairs. May work incorrectly with very exotic pairs, CFDs
or commodities."
#property description "Be careful: it will delete
all rectangle objects on the chart upon
deinitialization."
#property indicator_chart_window
input datetime StartFromDate = D'';
input
bool
StartFromToday = true;
input
int
DaysToCount
= 2; // Number of days for which to count the Market Profile
input
int
ColorScheme
= 0; // 0 - Blue to Red, 1 - Red to Green, 2 - Green to Blue
input
color
MedianColor
= White;
input
color
ValueAreaColor = White;
int
DigitsM;
// Amount of digits normalized for standard 4 and 2 digits after
dot
datetime
StartDate;
// Will hold either StartFromDate or Time[0]
double
onetick;
// One normalized pip
int
SecondsInPeriod;
// Will hold calculated amount of seconds in the selected timeframe
period
bool FirstRunDone = false; // If true - OnCalculate() was already
executed once
//+------------------------------------------------------------------+
//| Custom indicator initialization
function
|
//+------------------------------------------------------------------+
void OnInit()
{
IndicatorSetString(INDICATOR_SHORTNAME,
"MarketProfile");
//
Normalizing the digits to standard 4- and 2-digit quotes
if (_Digits
== 5) DigitsM = 4;
else if
(_Digits == 3) DigitsM = 2;
else DigitsM
= _Digits;
if
(_Period == PERIOD_M30) SecondsInPeriod = 1800;
if (_Period
== PERIOD_M15) SecondsInPeriod = 900;
if (_Period
== PERIOD_M5) SecondsInPeriod = 300;
onetick =
NormalizeDouble(1 / (MathPow(10, DigitsM)), DigitsM);
}
//+------------------------------------------------------------------+
//| Custor indicator deinitialization
function
|
//+------------------------------------------------------------------+
void OnDeinit(const int reason)
{
// Delete
all rectangles (it takes too much time to delete exactly those
rectangles that were created by this indicator)
ObjectsDeleteAll(0, 0, OBJ_RECTANGLE);
}
//+------------------------------------------------------------------+
//| Custom Market Profile main iteration
function
|
//+------------------------------------------------------------------+
int OnCalculate(const int rates_total,
const int prev_calculated,
const datetime &Time[],
const double &open[],
const double &High[],
const double &Low[],
const double &close[],
const long &tick_volume[],
const long &volume[],
const int &spread[])
{
if ((_Period
!= PERIOD_M30) && (_Period !=
PERIOD_M15) && (_Period !=
PERIOD_M5))
{
Print("TimeFrame should be set to M30, M15 or
M5.");
return(-1);
}
ArraySetAsSeries(High,
true);
ArraySetAsSeries(Low,
true);
ArraySetAsSeries(Time,
true);
if
(StartFromToday) StartDate = Time[0];
else
StartDate = StartFromDate;
// If we
calculate profiles for the past days, no need to rerun it
if
((FirstRunDone) && (StartDate !=
Time[0])) return(rates_total);
// Get
start and end bar numbers of the given date
int dayend =
FindDayEndByDate(Time, StartDate, rates_total);
int daystart
= FindDayStart(Time, dayend, rates_total);
int
DayToStart = 0;
// If all
days have already been counted, jump to the current one
if
(FirstRunDone) DayToStart = DaysToCount - 1;
else
{
// Move back to the oldest day to count to start from it
for (int i = 1; i < DaysToCount; i++)
{
dayend = daystart + 1;
daystart = FindDayStart(Time, dayend, rates_total);
}
}
// We
begin from the oldest day coming to today or to StartFromDate
for (int i =
DayToStart; i < DaysToCount; i++)
{
double DayMax = -1, DayMin = 99999999999;
// Find the day's high and low to
for (int bar = daystart; bar >= dayend; bar--)
{
if (High[bar] > DayMax) DayMax = High[bar];
if (Low[bar] < DayMin) DayMin = Low[bar];
}
DayMax = NormalizeDouble(DayMax, DigitsM);
DayMin = NormalizeDouble(DayMin, DigitsM);
int TPOperPrice[];
// Possible price levels if multiplied to integer
int max = (int)(round(DayMax / onetick) + 2); // + 2 because
further we will be possibly checking array at DayMax + 1
ArrayResize(TPOperPrice, max);
ArrayInitialize(TPOperPrice, 0);
int MaxRange = 0; // Maximum distance from day start to the drawn
dot
double PriceOfMaxRange = 0; // Level of the maximum range, required
to draw Median
double DistanceToCenter = 99999999; // Closest distance to center
for the Median
int TotalTPO = 0; // Total amount of dots (TPO's)
// Going through all possible quotes from daily High to daily
Low
for (double price = DayMax; price >= DayMin; price
-= onetick)
{
int range = 0; // Distance from first bar to the current bar
// Going through all bars of the day to see if the price was
encoutered here
for (int bar = daystart; bar >= dayend; bar--)
{
// Price is encountered in the given bar
if ((price >= Low[bar])
&& (price <=
High[bar]))
{
// Update maximum distance from day's start to the found bar
(needed for Median)
if ((MaxRange < range) || (MaxRange == range)
&& (MathAbs(price - (DayMin +
(DayMax - DayMin) / 2)) < DistanceToCenter))
{
MaxRange = range;
PriceOfMaxRange = price;
DistanceToCenter = MathAbs(price - (DayMin + (DayMax - DayMin) /
2));
}
// Draws rectangle
PutDot(price, Time[daystart], range, bar - daystart);
// Remember the number of encountered bars for this bars
TPOperPrice[(int)(price / onetick)]++;
range++;
TotalTPO++;
}
}
}
// Calculate amount of TPO's in the Value Area
int ValueControlTPO = (int)((double)TotalTPO * 0.7);
// Start with the TPO's of the Median
int TPOcount = TPOperPrice[(int)(PriceOfMaxRange / onetick)];
// Go through the price levels above and below median adding the
biggest to TPO count until the 70% of TPOs are inside the Value
Area
int up_offset = 1;
int down_offset = 1;
while (TPOcount < ValueControlTPO)
{
double abovePrice = PriceOfMaxRange + up_offset * onetick;
double belowPrice = PriceOfMaxRange - down_offset * onetick;
// If belowPrice is out of the day's range then we should add only
abovePrice's TPO's, and vice versa
if (((TPOperPrice[(int)(abovePrice / onetick)] >=
TPOperPrice[(int)(belowPrice / onetick)]) || (belowPrice
< DayMin)) &&
(abovePrice <= DayMax))
{
TPOcount += TPOperPrice[(int)(abovePrice / onetick)];
up_offset++;
}
else
{
TPOcount += TPOperPrice[(int)(belowPrice / onetick)];
down_offset++;
}
}
string LastName = " " +
TimeToString(Time[daystart], TIME_DATE);
// Delete old Median
if (ObjectFind(0, "Median" +
LastName) >= 0) ObjectDelete(0,
"Median " + LastName);
// Draw a new one
ObjectCreate(0, "Median" +
LastName, OBJ_RECTANGLE, 0, Time[daystart + 16], PriceOfMaxRange,
Time[(int)(MathMax(daystart - MaxRange - 5, 0))], PriceOfMaxRange +
onetick);
ObjectSetInteger(0, "Median" +
LastName, OBJPROP_COLOR, MedianColor);
ObjectSetInteger(0, "Median" +
LastName, OBJPROP_STYLE, STYLE_SOLID);
// Delete old Value Area
if (ObjectFind(0, "Value Area" +
LastName) >= 0) ObjectDelete(0,
"Value Area " + LastName);
// Draw a new one
ObjectCreate(0, "Value Area" +
LastName, OBJ_RECTANGLE, 0, Time[daystart], PriceOfMaxRange +
up_offset * onetick, Time[daystart] + (MaxRange + 1) *
SecondsInPeriod, PriceOfMaxRange - down_offset * onetick);
ObjectSetInteger(0, "Value Area"
+ LastName, OBJPROP_COLOR, ValueAreaColor);
ObjectSetInteger(0, "Value Area"
+ LastName, OBJPROP_FILL, false);
// Go to the newer day only if there is one or more left
if (DaysToCount - i > 1)
{
daystart = dayend - 1;
dayend = FindDayEndByDate(Time, Time[daystart], rates_total);
}
}
FirstRunDone
= true;
return(rates_total);
}
//+------------------------------------------------------------------+
//| Finds the day's starting bar number for any given bar
number.
|
//| n - bar number for which to find starting
bar.
|
//+------------------------------------------------------------------+
int FindDayStart(const datetime &Time[], int n, int
rates_total)
{
MqlDateTime
dt1, dt2;
int x =
n;
TimeToStruct(Time[n], dt1);
TimeToStruct(Time[x], dt2);
while
((dt1.day_of_year == dt2.day_of_year)
&& (x <
rates_total))
{
x++;
TimeToStruct(Time[x], dt2);
}
return(x -
1);
}
//+------------------------------------------------------------------+
//| Finds the day's end bar by the day's
date.
|
//+------------------------------------------------------------------+
int FindDayEndByDate(const datetime &Time[],
datetime date, int rates_total)
{
MqlDateTime
dt1, dt2;
int x =
0;
TimeToStruct(date, dt1);
TimeToStruct(Time[x], dt2);
while
((dt1.day_of_year < dt2.day_of_year)
&& (x <
rates_total))
{
x++;
TimeToStruct(Time[x], dt2);
}
return(x);
}
//+------------------------------------------------------------------+
//| Puts a dot (rectangle) at a given position and
color.
|
//| price and time are
coordinates.
|
//| range is for the second
coordinate.
|
//| bar is to determine the color of the
dot.
|
//+------------------------------------------------------------------+
void PutDot(double price, datetime time, int range, int bar)
{
string
LastName = " " +
IntegerToString(time + range * SecondsInPeriod) +
" " +
DoubleToString(price);
if
(ObjectFind(0, "MP" + LastName)
>= 0) return;
ObjectCreate(0, "MP" + LastName,
OBJ_RECTANGLE, 0, time + range * SecondsInPeriod, price, time +
(range + 1) * SecondsInPeriod, price + onetick);
// Color
switching depending on the distance of the bar from the day's
beginning
int colour,
offset1, offset2;
switch(ColorScheme)
{
case 0:
colour = DarkBlue;
offset1 = 0x020000;
offset2 = 0x000002;
break;
case 1:
colour = DarkRed;
offset1 = 0x000002;
offset2 = 0x000200;
break;
case 2:
colour = DarkGreen;
offset1 = 0x000200;
offset2 = 0x020000;
break;
}
if (_Period
== PERIOD_M30) colour += bar * offset1;
else if
(_Period == PERIOD_M15) colour += bar * (offset1 / 2);
else colour
+= (bar / 3) * (offset1 / 2);
if (_Period
== PERIOD_M30) colour -= bar * offset2;
else if
(_Period == PERIOD_M15) colour -= bar * (offset2 / 2);
else colour
-= (bar / 3) * (offset2 / 2);
ObjectSetInteger(0, "MP" +
LastName, OBJPROP_COLOR, colour);
// Fills
rectangle
ObjectSetInteger(0, "MP" +
LastName, OBJPROP_FILL, true);
}
//+------------------------------------------------------------------+
![]() 喜欢
喜欢
0
![]() 赠金笔
赠金笔