 加载中…
加载中…R学习笔记-数据框
| 分类: 数据挖掘 |
文章原文来自于网络:原文地址:http://www.biostatistic.net/thread-2344-1-1.html
有关数据框的引用:http://m.oschina.net/blog/102818
一般读取的table都作为数据框使用,所以数据框的使用显得比较重要。这里留下资料,便于以后查看:
数据框(Data frame) 前面我们已经看到一个数据框可以由函数read.
table 间接创建;这里也可以用函数data.frame来创建。数据框中的向
量必须有相同的长度,如果其中有一个比其它的短,它将“循环”整数
次(以使得其长度与其它向量相同):
> x <- 1:4; n <- 10; M <- c(10, 35); y <-
2:4
> data.frame(x, n)
x n
1 1 10
2 2 10
3 3 10
4 4 10
> data.frame(x, M)
x M
1 1 10
2 2 35
3 3 10
4 4 35
> data.frame(x, y)
Error in data.frame(x, y) :
arguments imply differing number of rows: 4, 3
如果一个因子包含在一个数据框中,它必须和其中的向量有相同的长
度。列名也是可以改变的,例如,data.frame(A1=x, A2=n)。用户也
可以使用row.names给行命名,但是,这个命名向量必须是字符型的而
且长度等于这个数据框的行数。最后,注意数据框和矩阵一样有维数这
个属性。
1 访问数据框变量
建议:在read.table命令执行names查看要处理的变量
> names(Squid)
[1] "Sample"
>
1.1 str函数
> str(Squid)
'data.frame':
>
Sample
GSI这个变量是数值型
GSI这个变量是存在于数据框Squid中的,不能通过在R控制台中输入GSI查看
> GSI
错误: 找不到对象'GSI'
>
1.2 函数中的数据参数--访问数据框中的变量的最佳方式
> M1 <- lm(GSI ~ factor(Location)+factor(Year),data =
Squid)
> M1
Call:
lm(formula = GSI ~ factor(Location) + factor(Year), data =
Squid)
Coefficients:
>
lm 是做线性回归的函数,data = Squid表示从数据框Squid中取变量
data = 并不是适用于任何函数,eg:
> mean(GSI,data = Squid)
错误于mean(GSI, data = Squid) : 找不到对象'GSI'
>
1.3 $ 符号 访问变量的另外一种方法
Squid$GSI
> Squid$GSI
或者
Squid[,6]
> Squid[,6]
此时可以通过mean求平均值
> mean(Squid$GSI)
[1] 2.187034
>
1.4 attach 函数
attach函数将数据框添加到R的搜索路径中,此时就可以通过GSI命令直接查看GSI数据
> attach(Squid)
> GSI
此时就可以直接使用相关函数了。
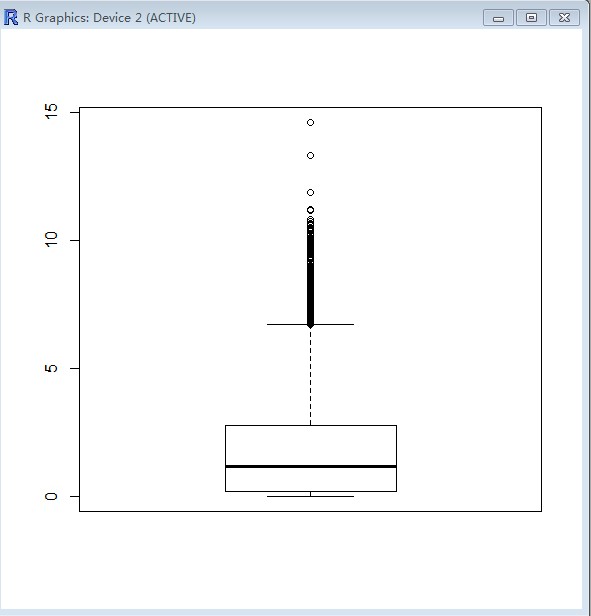
> boxplot(GSI)
>
http://static.oschina.net/uploads/space/2013/0117/212604_XzBw_252349.jpg
(额、、看不懂这个图)
使用attach函数显然应该小心保证变量名字的唯一性,如果与R自带函数名字或者变量一样肯定会出问题。
attach使用总结:
(1)为了避免复制变量,避免输入Squid$GSI两次以上
(2)使用attach命令应该保证变量的唯一性
(3)如果要处理多个数据集,而且一次只处理一个数据集,使用detach函数将数据集从R搜索路径中删除
2 访问数据集
首先执行detach(Squid)命令!!!
查看Squid中Sex的值
> Squid$Sex
显示位移值
> unique(Squid$Sex)
[1] 2 1
>
其中1表示雄性2表示雌性
> Sel <- Squid$Sex == 1
> SquidM <- Squid[Sel,]
> SquidM
24
48
58
60
61
Sel <- Squid$Sex == 1这条命令生成一个向量与Sex具有相同的长度,如果Sex的值等于1则该变量的值为TRUE,否则为FALSE,这样一个变量可称为布尔变量,可以用来选择行。
SquidM <- Squid[Sel,]这条命令表示选择Squid中Sel等于TRUE的行,并将数据存储到SquidM中。因为是选择行,所以需要使用方阔号。
第三章未完待续...
go
获得雌性数据
> SquidF <- Squid[Squid$Sex == 2,]
> SquidF
1
2
3
4
5
下面几条命令不解释:
unique(Squid$Location)
Squid123 <- Squid[Squid$Location == 1 | Squid$Location ==2 |
Squid$Location == 3,]
Squid123 <- Squid[Squid$Location != 4,]
Squid123 <- Squid[Squid$Location < 4 ,]
Squid123 <- Squid[Squid$Location <=3 ,]
Squid123 <- Squid[Squid$Location >=1 &Squid$Location
<=3 ,]
都是获得Location值为1,2,3的行
> unique(Squid$Location)
[1] 1 3 4 2
> Squid123 <- Squid[Squid$Location == 1 | Squid$Location ==2
| Squid$Location == 3,]
> Squid123
1
2
3
4
5
6
获得Location值为1的雄性数据行
> SquidM.1 <- Squid[Squid$Sex == 1 & Squid$Location ==
1,]
> SquidM.1
24
58
60
获得位置为1或2的雄性数据
> SquidM.12 <- Squid[Squid$Sex == 1 &( Squid$Location ==
1 | Squid$Location == 2),]
> SquidM.12
24
58
60
> SquidM1 <- SquidM[Squid$Location == 1,]
> SquidM1
24
58
..........
..........
NA
NA.1
NA.2
NA.3
NA.4
..........
原因分析:
之前得到的SquidM表示雄性数据,显然SquidM的行数与Squid$Location == 1 布尔向量的长度不一致。因此导出出现上面的现象。
2.1 数据排序
> Ord1 <- order(Squid$Month)
> Squid[Ord1,]
1
2
3
4
根据月份排序
> Squid$GSI[Ord1]
3 使用相同的标识符组合两个数据集
> setwd("E:/R/R-beginer-guide/data/RBook")
> Sql1 <- read.table(file = "squid1.txt",header = TRUE)
> Sql2 <- read.table(file = "squid2.txt",header = TRUE)
> SquidMerged <- merge(Sql1,Sql2,by = "Sample")
> SquidMerged
1
2
3
4
5
6
merge 命令采用两个数据框Sql1 ,Sql2作为参数并使用变量Sample作为形同的标识符合并两个数据。merger函数还有一个选项是all,缺省状态值是FALSE:即如果Sql1或Sql2中的值有缺失,则将被忽略。如果all的值设置为TRUE,可能会产生NA值
Sql11 <- read.table(file = "squid1.txt",header = TRUE)
Sql21 <- read.table(file = "squid2.txt",header = TRUE)
SquidMerged1 <- merge(Sql11,Sql21,by = "Sample")
SquidMerged1
额、、这里好像没有出现NA,看来是数据没有丢失
4 输出数据
通过write.table将数据输出为ascii文件
write.table(SquidM,file = "MaleSquid_wujiahua.txt",sep = " ",quote
=
查看工作目录,生成了一个MaleSquid_wujiahua.txt文件,
打开:
Sample Year Month Location Sex GSI
24 24 1 5 1 1 5.297
48 48 1 5 3 1 4.2968
58 58 1 6 1 1 3.5008
60 60 1 6 1 1 3.2487
61 61 1 6 1 1 3.2304
说明:
write.table第一个参数表示要输出的数据,第二参数是数据保存的文件名,sep = " " 宝成数据通过空格隔开,qoute=FALSE消除字符串的引号标识,na="NA"表示缺失值通过NA替换。append=TRUE表示把数据添加到文件的尾部
5 重新编码分类变量
> str(Squid)
'data.frame':
其中Sex和locaton的值确定,属于分类变量。
在数据框中一般根据分类变量生成新的变量
> Squid$fLocation <- factor(Squid$Location)
> Squid$fSex <- factor(Squid$Sex)
> Squid$fLocation
> Squid$fSex
[2591] 1 1 1 1 1 1 1 1 1 2 1 1 2 1 1 2 1 1 1 2 1 2 1 1 2 1 1 2 1 2
2 1 1 1 1
[2626] 1 1 1 1 1 2 1 1 1 2 1 2 1 2 1 2 1 1 1
Levels: 1 2
levels:1,2可以对其修改
> Squid$fSex <- factor(Squid$Sex,levels = c(1,2),labels =
c("M","F"))
> Squid$fSex
[2556] F M M M M F F M M M M M M M F M M M M M M F M M F M M M F M
M F M M M
[2591] M M M M M M M M M F M M F M M F M M M F M F M M F M M F M F
F M M M M
[2626] M M M M M F M M M F M F M F M F M M M
Levels: M F
>
这样每个1被M替换,2被F替换
使用重新分类的因子变量
boxplot(GSI ~ fSex,data = Squid)
http://static.oschina.net/uploads/space/2013/0118/113417_mFvd_252349.jpg
> M1 <- lm(GSI ~ fSex+fLocation,data = Squid)
> M1
Call:
lm(formula = GSI ~ fSex + fLocation, data = Squid)
Coefficients:
(Intercept)
> summary(M1)

Call:
lm(formula = GSI ~ fSex + fLocation, data = Squid)

Residuals:
    Min      1Q  Median      3Q     Max
-3.4137 -1.3195 -0.1593  1.2039 11.2159

Coefficients:
            Estimate Std. Error t value Pr(>|t|)
(Intercept)  1.35926    0.07068  19.230   <2e-16 ***
fSexF        2.02481    0.09427  21.479   <2e-16 ***
fLocation2  -1.85525    0.20027  -9.264   <2e-16 ***
fLocation3  -0.14248    0.12657  -1.126   0.2604
fLocation4   0.58756    0.34934   1.682   0.0927 .
---
Signif. codes:  0 ‘***’ 0.001 ‘**’ 0.01 ‘*’ 0.05 ‘.’ 0.1 ‘ ’ 1

Residual standard error: 2.415 on 2639 degrees of freedom
Multiple R-squared: 0.1759,     Adjusted R-squared: 0.1746
F-statistic: 140.8 on 4 and 2639 DF,  p-value: < 2.2e-16

>
(才发现有这么一个插入脚本功能)
> M2 <- lm(GSI ~ factor(Sex)+factor(Location),data = Squid)
> summary(M2)

Call:
lm(formula = GSI ~ factor(Sex) + factor(Location), data = Squid)

Residuals:
    Min      1Q  Median      3Q     Max
-3.4137 -1.3195 -0.1593  1.2039 11.2159

Coefficients:
                  Estimate Std. Error t value Pr(>|t|)
(Intercept)        1.35926    0.07068  19.230   <2e-16 ***
factor(Sex)2       2.02481    0.09427  21.479   <2e-16 ***
factor(Location)2 -1.85525    0.20027  -9.264   <2e-16 ***
factor(Location)3 -0.14248    0.12657  -1.126   0.2604
factor(Location)4  0.58756    0.34934   1.682   0.0927 .
---
Signif. codes:  0 ‘***’ 0.001 ‘**’ 0.01 ‘*’ 0.05 ‘.’ 0.1 ‘ ’ 1

Residual standard error: 2.415 on 2639 degrees of freedom
Multiple R-squared: 0.1759,     Adjusted R-squared: 0.1746
F-statistic: 140.8 on 4 and 2639 DF,  p-value: < 2.2e-16

>
估计的参数是一致的,但是第二种方式占用的屏幕空间更大,传说在二阶,三阶交互作用时将是一个严重的问题。
> Squid$fLocation
   [1] 1 3 1 1 1 1 1 3 3 1 1 1 1 1 1 1 3 1 3 1 3 1 1 1 1 1 1 1 1 1 1 1 1 1 1
  [36] 1 1 1 1 3 1 1 1 1 3 1 1 3 1 1 1 1 1 1 1 3 1 1 1 1 1 3 1 1 1 1 1 1 1 1
........
[2626] 1 1 1 1 1 1 1 1 1 1 1 1 1 1 1 1 1 1 1
Levels: 1 2 3 4
Levels:的顺序可以更改
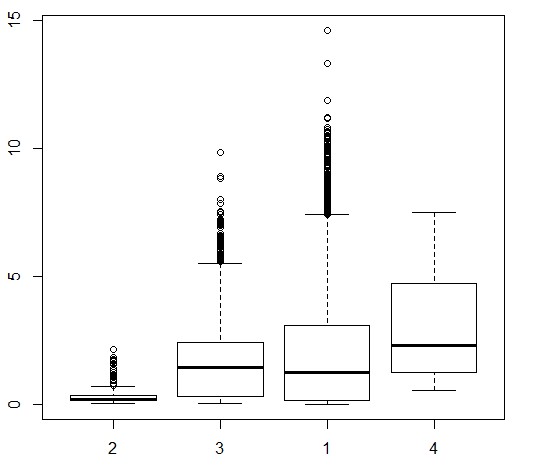
> Squid$fLocation <- factor(Squid$Location,levels= c(2,3,1,4))
> Squid$fLocation
   [1] 1 3 1 1 1 1 1 3 3 1 1 1 1 1 1 1 3 1 3 1 3 1 1 1 1 1 1 1 1 1 1 1 1 1 1
  [36] 1 1 1 1 3 1 1 1 1 3 1 1 3 1 1 1 1 1 1 1 3 1 1 1 1 1 3 1 1 1 1 1 1 1 1
  [71] 1 1 1 1 1 3 1 1 3 1 1 3 1 1 3 1 1 1 1 1 1 1 1 1 1 1 1 3 1 3 3 3 1 3 1

...


] 1 1 1 1 1 1 1 1 1 1 1 1 1 1 1 1 1 1 1
Levels: 2 3 1 4
boxplot(GSI ~ fLocation,data = Squid)
http://static.oschina.net/uploads/space/2013/0118/114828_Krme_252349.jpg
注意:
SquidM <- Squid[Squid$Sex == 1,]
SquidM <- Squid[Squid$fSex == "1"]
在定义了fSex这个因子之后上面两种写法都是一样的效果。
但是1有双引号是必须的,因为fSex是因子
定义新的变量之后也可以通过str命令查看
> Squid$fSex <- factor(Squid$Sex,labels = c("M","F"))
> Squid$fLocation <- factor(Squid$Location)
> str(Squid)
'data.frame':   2644 obs. of  8 variables:
 $ Sample   : int  1 2 3 4 5 6 7 8 9 10 ...
 $ Year     : int  1 1 1 1 1 1 1 1 1 1 ...
 $ Month    : int  1 1 1 1 1 1 1 1 1 2 ...
 $ Location : int  1 3 1 1 1 1 1 3 3 1 ...
 $ Sex      : int  2 2 2 2 2 2 2 2 2 2 ...
 $ GSI      : num  10.44 9.83 9.74 9.31 8.99 ...
 $ fLocation: Factor w/ 4 levels "1","2","3","4": 1 3 1 1 1 1 1 3 3 1 ...
 $ fSex     : Factor w/ 2 levels "M","F": 2 2 2 2 2 2 2 2 2 2 ...
>
第三章总结:
write.table
order
merge
str
factor
![]() 喜欢
喜欢
0
![]() 赠金笔
赠金笔