 加载中…
加载中…日本股市失落的二十年
标签:
东阿阿胶保健品投资杂谈 |
分类: 投资方向 |

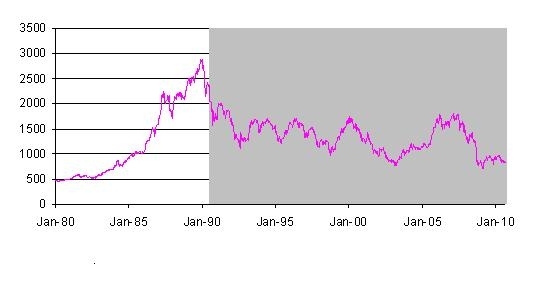
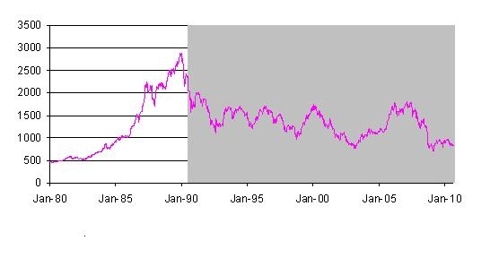
TPX指数从1990年开始到2010年回报为负,但是10%指数成分股录得正收益。
The market has pushed the Fed to such an extent, now it is more a question of when and how much the new QE2 will be, rather than if there is going to be a QE2. But unfortunately there is no guarantee that QE2 will achieve what QE1 failed to achieve. At the moment it seems more like new QE2 will create more asset bubbles in emerging markets rather than being distributed to the US economy.
When you consider the idea of fed is running out of options to jump start the US economy; with a backdrop of a weak unemployment situation, a struggling housing market and a weakening financial situation for the local state governments, It looks more and more clearer that we will see a repetition of a Japanese style lost decade in the US economy. In my view this is not necessarily a bad thing for the US investors.
Figure 1: TPX
Index
http://static.seekingalpha.com/uploads/2010/10/14/84436-128704444875035-Muditha-Weeratunga.jpg
(Click to enlarge)
As I show below, the key investment theme was, to invest in defensive sectors or to invest in companies with higher percentage of income coming from export markets. The good news for the US investor is that the current S&P 500 provides more opportunities than the TPX index in early 1990.
- Defensive sectors significantly performed better than rest of the market.
TPX had 1117 stock in 1993, of those stocks C.25% doesn’t exist any more. But then again C. 10% of the stocks have returned positive returns during the last 17 years. Look at the table below; Utilities, Healthcare and Consumer Staples had the best results. More than 50% of the Utility and Healthcare stocks had positive returns during the last 17 years.
|
Sector
|
# of stocks
|
Current Market cap (JPY T)
|
Sector Weighting
|
# stocks up
|
# stocks up as a % of stocks in the
sector
|
|
Consumer Discretionary
|
153
|
32.8
|
18%
|
18
|
12%
|
|
Consumer Staples
|
58
|
8.7
|
5%
|
10
|
17%
|
|
Energy
|
12
|
1.1
|
1%
|
1
|
8%
|
|
Financial
|
89
|
18.2
|
10%
|
6
|
7%
|
|
Healthcare
|
26
|
12.1
|
7%
|
13
|
50%
|
|
Industrials
|
264
|
44.2
|
25%
|
20
|
8%
|
|
Information Technology
|
76
|
25.8
|
15%
|
13
|
17%
|
|
Materials
|
131
|
17.4
|
10%
|
12
|
9%
|
|
Telecoms
|
1
|
5.8
|
3%
|
0
|
0%
|
|
Utilities
|
15
|
11.4
|
6%
|
8
|
53%
|
|
Discontinued
|
292
|
0.2
|
0%
|
0
|
0%
|
|
Total
|
1117
|
177.6
|
100%
|
101.0
|
9%
|
Unfortunately I was not able to find the market cap of the Japanese stocks during the 1990s. It would have been interesting to see how the significance of different sectors changed during this period. Currently Industrials, Consumer Discretionary and Information Technology sectors remains the 3 largest sectors by the market cap.
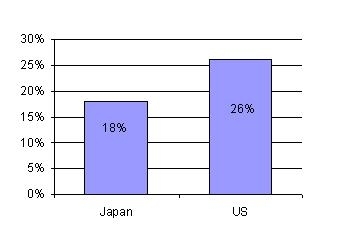
- The US market is better prepared for a “lost decade” than the Japanese market in early 1990
The key sectors during the lost decade in Japan were Utilities, Healthcare and Consumer Staples. Under the current market weightings, even after allowing for a certain level of survivorship biasness these 3 sector account for only 18% of the TPX index. In S&P 500 Index these 3 sectors already account for 26% of the total market cap. Which suggests that the S&P 500 is better prepared for a lost decade than the TPX index was in early 1990.
Even by the stock count, the current US market provides a better investment opportunity for a “lost decade.” In TPX index in 1990 only 99 stocks were from these 3 sectors. That is only a 9% of the total stocks that were available under the TPX Index. In the US currently there are 126 stocks from these 3 sectors and that is 25% of all the stocks from S&P 500.
|
Figure-2: Defensive sector weight by market Cap in the broader
index
|
Figure-3: Defensive sector weight by stock count in the
broader index
|
http://static.seekingalpha.com/uploads/2010/10/14/84436-128704464945059-Muditha-Weeratunga.jpg
- Stocks with a diversified geographical revenue streams did better.
In the table below, I have highlighted the top 10 performing Japanese stocks for the last 17 years. With the exception of one company, they are either from a defensive sector or they have diversified their earning streams to different geographical locations. On average these stocks have returned 261% return, in my view not bad for a lost decade.
Table 2: TPX Index top 10 performing stocks during the last 17 years
|
Name
|
Sector
|
Return over 17 years
|
Rev. share outside Japan
|
|
Hisamitsu Pharmaceutical Co (HTSUF.PK)
|
Healthcare
|
567%
|
6%
|
|
Honda Motor Co Ltd (HMC)
|
Consumer Discretionary
|
332%
|
78%
|
|
Canon Inc (CAJ)
|
Information Technology
|
307%
|
75%
|
|
Hoya Corp (HOCPY.PK)
|
Information Technology
|
239%
|
64%
|
|
Takeda Pharmaceutical Co Ltd (TKPHF.PK)
|
Healthcare
|
219%
|
46%
|
|
Santen Pharmaceutical Co Ltd (SNPHF.PK)
|
Healthcare
|
210%
|
12%
|
|
Shin-Etsu Chemical Co Ltd (SHECF.PK)
|
Materials
|
197%
|
62%
|
|
Terumo Corp (TRUMY.PK)
|
Healthcare
|
188%
|
45%
|
|
Keyence Corp (KYCCF.PK)
|
Information Technology
|
182%
|
29%
|
|
Suzuki Motor Corp (SZKMF.PK)
|
Consumer Discretionary
|
169%
|
61%
|
|
Average
|
261%
|
48%
|
久光制药有限公司(
本田汽车公司(HMC)
佳能公司(CAJ)
豪雅公司(
武田药品有限公司(
参天制药有限公司(
信越化学工业(
泰尔茂公司(
基恩士公司(
铃木汽车公司(
平均
In one my previous blogs I have highlighted the geographical distribution of the revenue streams for the S&P 500 companies. Currently the S&P 500 companies generate C.40% of their revenue outside the US market. This is less than the 48% average of the top 10 TPX stocks. But it is not a large gap. The US companies are already diversifying into emerging markets and they are well prepared to capture the market share from the developing middle class in emerging markets. Hence I believe the US companies will be able to capture this revenue diversification gap soon.
![]() 喜欢
喜欢
0
![]() 赠金笔
赠金笔