 加载中…
加载中…l两种方法估算黄金价格
标签:
黄金市场金融危机 |
分类: 黄金戒纸 |
已采出的地面上的黄金总量:1:被全球总货币量除;2:被M1除.
前者得出的黄金理论价格为:738US$/OZ;后者为3545US$/OZ.
the total ounces of gold above ground will be divided by:
1:The total amount of currency (physical paper money only)
2:The aggregate sum of published M1 money supply (primarily currency and demand deposits) figures from the world's central banks
Amount of Aboveground Gold
According to GFMS Ltd , the aboveground stocks of gold at the end of 2007 were 161,000 tonnes. Jewellery makes up the largest component of this inventory. According to the September 2008 release from World Gold Council the total official gold holdings of the world's central banks and vaults of the International Monetary Fund and Bank of International Settlements is 29,783.9 metric tonnes, representing over eighteen percent of the total inventory.
An average of an additional 2209 tonnes of gold (minus producer hedging) was added on an annual basis over the last five years. This represents a 1.4% annual inflation rate of the gold supply. The known reserves of world mining companies are estimated to be another 45,000 tonnes.
Amount of Currency in Circulation
A tabulation of the major currencies in the world converted into USD as of Oct 8, 2008 amounts to US$3.8 trillion. If we include the value of all demand deposits (approximated by using official M1 money supply numbers) the volume of the money expands to $18.4 trillion. The most recent official figures available were used for determining the values of the different currencies as shown in the table below.
| Economic Area | M0 ($US Billions) | M1 ($US Billions) | Date |
|---|---|---|---|
| EU | 888.17 | 5007.46 | Aug-08 |
| US | 775.40 | 1389.3 | Aug-08 |
| Japan | 712.11 | 4700.03 | Sep-08 |
| China | 443.86 | 2231.72 | Dec-07 |
| Russia | 145.43 | 201.83 | Jul-08 |
| India | 129.64 | 232.32 | Jul-08 |
| UK | 87.93 | 1710.52 | Aug-08 |
| Canada | 45.99 | 364.94 | Aug-08 |
| Poland | 43.12 | 139.71 | Aug-08 |
| South Korea | 41.25 | 218.78 | Apr-08 |
| Mexico | 37.61 | 100.28 | Aug-08 |
| Switzerland | 31.82 | 227.39 | Aug-08 |
| Australia | 28.97 | 164.64 | Aug-08 |
| Ukraine | 26.93 | 38.97 | Aug-08 |
| Taiwan | 24.36 | 95.18 | Aug-08 |
| Brazil | 24.36 | 49.45 | May-08 |
| Thailand | 24.09 | 28.9 | Jul-08 |
| Argentina | 23.08 | 37.48 | Sep-08 |
| Turkey | 22.51 | 43.45 | Sep-08 |
| Saudi Arabia | 20.42 | 111.33 | Aug-08 |
| Egypt | 19.87 | 32.01 | Dec-07 |
| Indonesia | 19.65 | 47.68 | Jul-08 |
| Czech Republic | 18.26 | 88.62 | Aug-08 |
| Sweden | 15.02 | 195.14 | Aug-08 |
| South Africa | 12.55 | 81.13 | Aug-08 |
| Pakistan | 12.40 | 44.84 | Sep-08 |
| Singapore | 12.03 | 49.81 | Jul-08 |
| Malaysia | 11.54 | 49.87 | Aug-08 |
| Hungary | 10.94 | 32.81 | Aug-08 |
| Denmark | 9.32 | 144.13 | May-08 |
| Venezuala | 8.76 | 48.45 | Sep-08 |
| Colombia | 8.39 | 16.69 | Sep-08 |
| Romania | 8.34 | 31.68 | Jul-08 |
| Nigeria | 8.04 | 36.14 | Aug-08 |
| Philippines | 7.76 | 18.83 | Mar-08 |
| Norway | 7.25 | 123.2 | Jul-08 |
| UAE | 7.06 | 49.46 | Dec-07 |
| Israel | 6.78 | 18.79 | Dec-05 |
| Slovakia | 5.84 | 26.18 | Jul-08 |
| Bulgaria | 5.45 | 14.63 | Aug-08 |
| Peru | 5.37 | 7.61 | Aug-08 |
| Bangladesh | 4.89 | 8.72 | Jul-08 |
| Chile | 3.58 | 16.53 | Dec-07 |
| Lithuania | 3.24 | 10.21 | Aug-08 |
| Kuwait | 2.93 | 17.38 | Aug-08 |
| Sudan | 2.16 | 4.97 | Dec-07 |
| Belarus | 2.01 | 4.83 | Sep-08 |
| Latvia | 2.00 | 7.10 | Jan-08 |
| New Zealand | 1.85 | 14.14 | Aug-08 |
| Sri Lanka | 1.36 | 2.47 | Dec-07 |
| Lebanon | 1.24 | 2.44 | Jul-08 |
| Estonia | 1.08 | 6.93 | Aug-08 |
| Moldova | 0.71 | 1.13 | Aug-08 |
| Iceland | 0.12 | 4.05 | Aug-08 |
Please note that some of the data is less current (i.e. latest data for China is from Dec 2007) or simply unavailable (i.e. Iran).
A previous analysis of the 25 largest economic regions of the world in July 2008 suggests an annual inflation rate of 6.6% for the paper money.
There is no limit to the amount of currency a country can issue, but its value is determined by the public's collective confidence. The severe socio-economic destruction caused by hyperinflation occurs when this value approaches zero. A list of failed currencies can be found here.
Estimating a Price for Gold
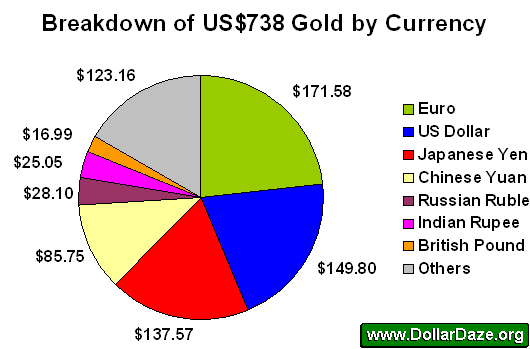
A troy ounce is 31.1 grams, thus the 161,000 tonnes of gold is equal to 5,176 million ounces of gold. Dividing the total amount of currency (US$3.8 trillion) by 5,176 million ounces gives us a figure of US$738 per ounce.
The chart below shows the composition by currency of such a comparison.
The chart below shows the composition by currency of such a comparison.
http://www.marketoracle.co.uk/images/2008/738_Gold.png
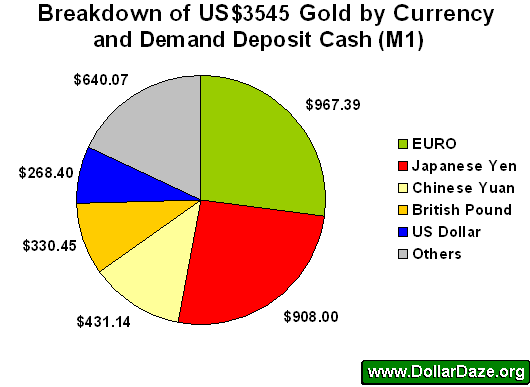
The next chart indicates the break-down in price for an ounce of gold by dividing the currency and demand deposits of the world ($18.4 trillion) by the estimated number of aboveground gold (5,176 million ounces).
http://www.marketoracle.co.uk/images/2008/3545_Gold.png
Extrapolating the present inflation rates for both gold and paper currency produces an annual price increase of 5.2% (6.6% paper inflation - 1.4% gold inflation) for the price of gold.
Conclusions
These two analyses are meant to provide a measure of comparing the amount of gold in the world to the amount of paper money using published official sources. The two measures of money used are themselves quite limited in scope.
Currency as physical paper is the most restrictive form of measuring the money supply and the most straightforward method conceptually. It is generally accepted practice to also include demand deposits when discussing money supply, as this is a form of money available to the depositor upon demand. Savings accounts are sometimes considered as money, but not always, as it may be argued that the bank (in theory) may demand some time to acquire physical cash to redeem a withdrawal.
Obviously the inclusion of other broader forms of money (various instruments of savings deposits, money market deposit accounts, repurchase agreements, money mutual funds, etc) would further increase the price of gold in such a comparison.
Whether such comparisons are of value beyond that of curiousity, I leave to the discretion of the reader.
![]() 喜欢
喜欢
0
![]() 赠金笔
赠金笔