 加载中…
加载中…SNPTrackerOFCTS7634*
标签:
分子人类学 |
分类: cts7634 |

Code version 2021-05-29; Y tree updated 2021-09-17; mt tree updated 2021-09-17
Westward Migration
Population Growth Rate
Ancient DNA Samples
Use the (/) toggle button to choose Y DNA () or mitochondrial (mt) DNA ().
Simply type
your haplogroup (ideally your terminal SNP) into the input box and
click “Go” or hit return. If this SNP is known to the FTDNA Y or mt
Tree, the map will show the path from “Y Adam” or “Mitochondrial
Eve” to the SNP. You need type only the lower-level code, for
example “M222” instead of the full “R-M222”. Y SNP names are as in
FTDNA, not the older nomenclature, thus “I-L160” and not “I2a1a1”
(although many short ‘classic’ labels will work, like R1a or G2).
If what shows at the top-left of the map is different from what you
typed, that’s because the tool automatically searches all SNP
synonyms and displays the current FTDNA nomenclature. If your
haplogroup is missing, then it’s not in the FTDNA Y or mt Tree. You
may also select examples from the drop-down menu or tap the
“shuffle” button (
Hold down
the option/alt key and click (
Once you
have a path showing you can open the options panel
(click
“Zoom to
Europe” toggles between views of Eurasia/Africa and Europe. The
camera button (
“Show
“Show
“Show
Topography” toggles between a minimal coastline background and an
topographic map. The topographic map was generously created Tom
Patterson; he and his and colleagues at Natural Earth (
“Show Descendants” displays the descendants of the SNPs in your path. Within the path, arrows indicate the distance (by length) and number (by width) of the first-level branches from the SNP. For the last SNP, all SNP descendants are shown. This has no effect if your path ends in a terminal SNP, but it gives dramatic results with major ancestral SNPs such as F-M89 (ancient Mesopotamia), I-M170 (associated with Western Hunter-Gatherer), R-M417 (Eastern Hunter-Gatherer), R-L23 (Yamnaya), and I-M253 (early Scandinavian). The descendant SNP dots have the usual color code, so for example with F-M89 you can see the gradient of migration northwest over the millenia. The strong selection bias of FTDNA testers is also evident in the Finland-to-Britain dominance of locations.
Notice how dramatically different our paths have been from Africa: Try the examples with multiple paths to England, the Isle of Man, and Finland. Your next-door neighbor’s ancestors might have taken a prehistoric path thousands of miles and years different from yours.
Find long loops and round trips. Compare R1a to R1b: They’re together until they get out to Mongolia and Lake Baikal, then split with R1a taking the northern route west to Europe, while R1b retraces its ancient path and weaves around the Caspian and Black Seas, finally following the Danube valley into Europe.
At some point, averaging data to estimate locations simply gives silly results. A Spanish mother and German father doesn’t make me French (geographically halfway). And yet there is power in numbers and averages: if a certain SNP has 10 descendants who say that they’re Irish and 2 who say something else, and you have that SNP, the probability of you having Irish ancestry is significant.
For many people the Neolithic is a sweet spot: severe bottlenecks followed by strong population expansions resulted in a few very big SNPs like R-U106, R-P312, and I-M253. Descendants of these will see a fairly tight cluster of blue (Neolithic) dots in one region. High numbers lead to reasonable averages and often smooth downstream paths to Finland or Scotland.
Many Middle Eastern SNPs are a middle ground: the history of J-FGC2 is scattered from Mesopotamia to Anatolia in the Paleolithic and Neolithic, then settles down to Saudi Arabia (probably with testing bias). SNPs with lower testing levels are the most scattered: paths from T, G, and J2 tend to be poorly determined.
Also beware of the scatter associated with large countries: Russia and China get a single central location despite their huge geographic size. A single Russian descendant can pull a SNP point many hundreds of miles across Europe, even though that Russian ancestor might have lived just over the Estonian border.
This tool depends on the generosity of Family Tree DNA (FTDNA) in making their Y SNP Tree data accessible. Note that there is no personal data involved (no kit numbers), only the phylogeny of the tree and self-reported ancestor locations. The initial versions of this tool used my own SNP dates, but since the Y Tree data feed does not include private variants, many SNPs got dates that were much too recent. The tool now uses dates from YFull: about a quarter of the SNPs in the Y Tree have corresponding dated SNPs in YFull which suffice for interpolation to cover the entire tree.
SNP
formation dates in YFull are estimated by the method of Adamov et
al
Map locations are intended to show where a given SNP mutation occurred, not where a haplogroup may be most prevalent today. Locations are estimated with a combination of (1) averages of FTDNA testers’ reported ancestry for over 20,000 Y or 5400 mt SNPs, and (2) about 150 specific SNPs that I have anchored based on academic scholarship. These sources are complementary: paleolithic dates are very poorly estimated by modern testers’ history but a small number of academically-located paleolithic SNPs suffice for the most populous branches. On the other hand, averages of modern reported ancestry are often quite good for medieval to modern localization.
Wikipedia
and its references are a major source for academic SNP locations.
The Indo-European project
Carlos
Quiles recently shared his hand-curated list of over 8700 ancient
human remains with locations, dates, and Y and/or mtDNA
haplogroups. But even with this trove of data and five different
approaches, automated methods relying solely on ancient sites are
no match for human interpretation. See
I hand-curated a few anchored points where the given locations would have required a very unusual rate of migration. It is also worth noting that a number of published ancestral tracks are probably incorrect because they do not fully account for the time-sequence of SNPs. Every path on this map is drawn by traversal of the Y or mt SNP tree and thus always in correct past-to-present order.
As more men do BigY DNA testing the Y SNP tree has grown to the point where many terminal SNPs now overlap the timescale of paper genealogy; this allows those testers to pinpoint the precise origin of that SNP in time and geography. SNP Tracker identifies these SNPs and fixes those that have a single country location. In addition, I will add more specific data if asked. Use the button below to email me your SNP name, surname, SNP formation date, and origin latitude and longitude in decimal degrees, not degrees/minutes/seconds; west longitude is negative. Note that only European or Asian locations will show on the map, so even if your terminal SNP is actually in North America, give me the last known European location. Only BigY terminal SNPs please: I will not modify any SNP with more than one surname attached, or any earlier than about 1800 CE. I generally do data updates every 4-6 weeks.
Since
November 2019 ancient SNP paths are computed as a whole, taking
account of their interdependencies, and recent paths may be
optionally anchored to very recent terminal SNPs that cite a single
ancestral country. The latter change recognizes the increase in
BigY data which means that many customers’ terminal SNPs now extend
(in time and geography) into the range of paper genealogy. See the
Research Report
SNP Tracker can display 14,000 ancient samples with Y and/or mtDNA, but to reduce visual clutter and confusion, only those that apply to a given SNP are shown, and then only when the “walking man” reaches the time period when that ancient person lived. Pause the animation and drag the slider manually to see the skull icons appear and fade under your control.
http://scaledinnovation.com/gg/images/st2.jpg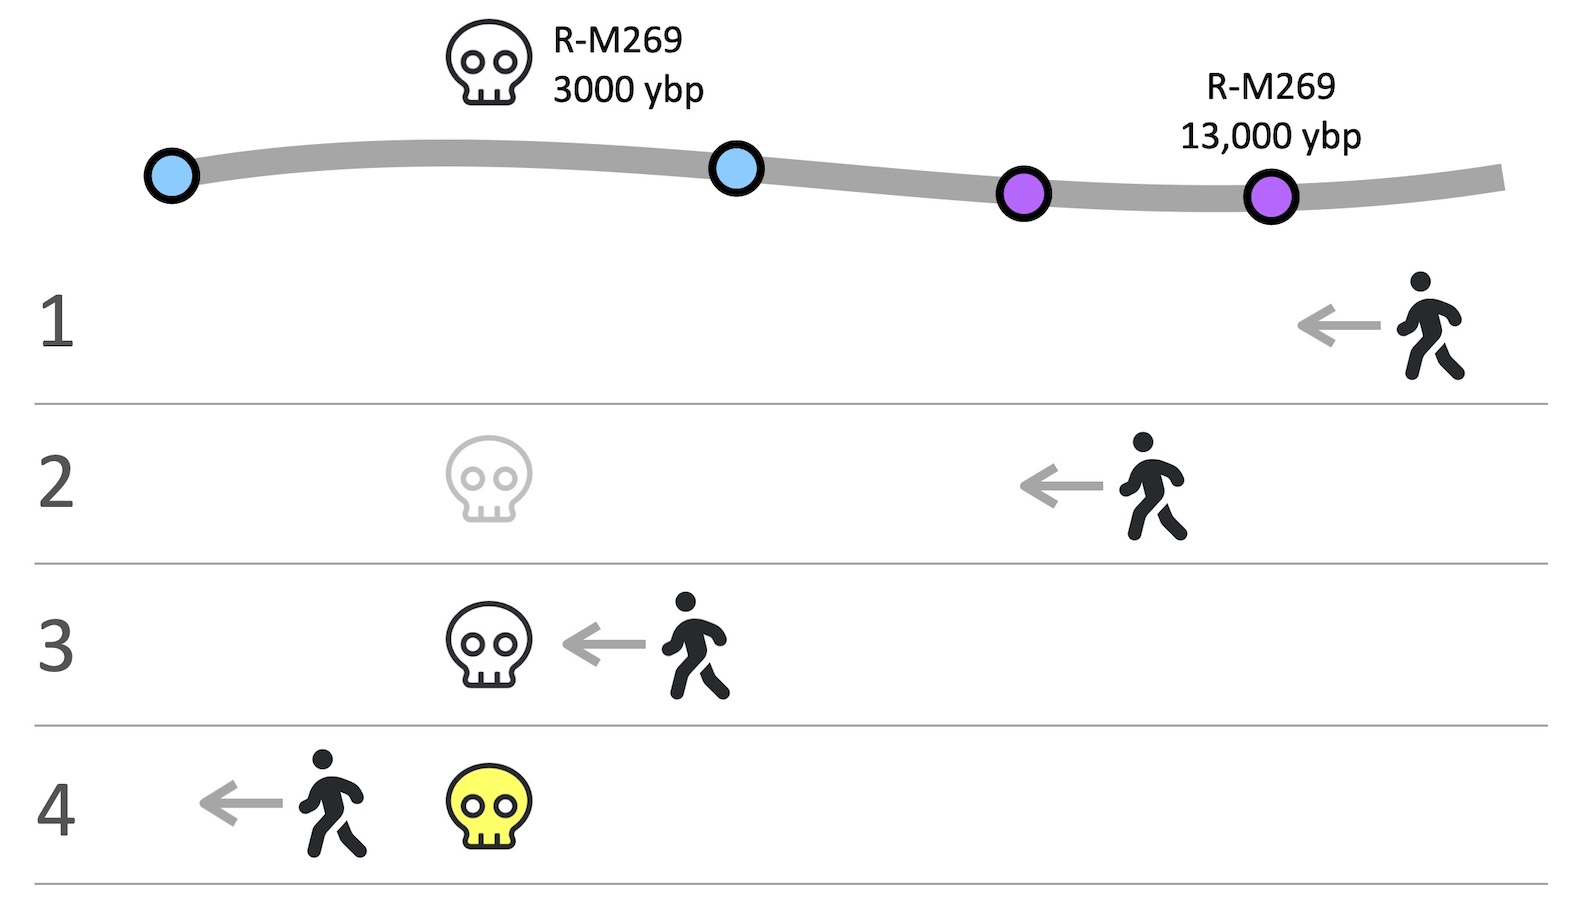
The skull icon denoting an ancient site will change appearance as the walking icon moves. The cartoon shows a site with SNP R-M269 and date 3000 years before present, while SNP R-M269 was formed 13,000 ybp and is much farther east. Before the walker gets to R-M269 (1) the skull doesn’t appear — it couldn’t have existed yet. Once the walker passes M269 (2) the skull appears but faintly because of the large time discrepancy. As the walker gets close to the date of the skeleton (3), the skull gets darker, and as the walker proceeds past the time of the skeleton (4) the icon becomes yellow, as if the bones are aging.
All data
are from Carlos Quiles’ compilation spreadsheets which are
available at his website
Also note that any ancient skeleton is very unlikely to be a direct ancestor, but rather a person who split from your lineage at the point where the shared SNP arose.
This tool is entirely free and it comes with no guarantees. I have tried to make the maps as accurate as possible, but the more recent points on any path will depend on self-reported countries of ancestry. They will change as new data arrive. If and when FTDNA adds dates to their Y Tree data, I will adopt those since they’re likely to be more accurate than my method of interpolation from YFull.
If you think that I got something wrong, particularly in paleolithic locations, please let me know; if you include research and references to back up your assertion, then I will modify the paths. Remember that I cannot control recent (post-Roman) locations because they’re based on FTDNA user data.
Please tell me about your ideas for improvement and stories where this tool has been of particular interest to you.
Choose "Show
Rob Spencer
![]() 喜欢
喜欢
0
![]() 赠金笔
赠金笔