 加载中…
加载中…MACD与KDJ:双金叉策略
标签:
股票 |
分类: 股市投资之技术指标 |
MACD与KDJ:双金叉策略
Ask any technical trader and he or she will tell you that the right indicator is needed to effectively determine a change of course in a stocks' price patterns. But anything that one "right" indicator can do to help a trader, two complimentary indicators can do better. This article aims to encourage traders to look for and identify a simultaneous bullish MACD crossover along with a bullish stochastic crossover and then use this as the entry point to trade.
Pairing the Stochastic and MACD
Looking for two popular indicators that work well together resulted in this pairing of the stochastic oscillator and the moving average convergence divergence (MACD). This team works because the stochastic is comparing a stock's closing price to its price range over a certain period of time, while the MACD is the formation of two moving averages diverging from and converging with each other. This dynamic combination is highly effective if used to its fullest potential. (For background reading on each of these indicators, see Getting To Know Oscillators: Stochastics and A Primer On The MACD.)
将KDJ和MACD指标配对使用
Working the Stochastic
如何使用KDJ指标
There are two components to the stochastic oscillator: the %K and the %D. The %K is the main line indicating the number of time periods, and the %D is the moving average of the %K.
Understanding how the stochastic is formed is one thing, but knowing how it will react in different situations is more important. For instance:
Common triggers occur when the %K line drops below 20 - the stock is considered oversold, and it is a buying signal.
If the %K peaks just below 100, then heads downward, the stock should be sold before that value drops below 80.
Generally, if the %K value rises above the %D, then a buy signal is indicated by this crossover, provided the values are under 80. If they are above this value, the security is considered overbought.
Working the MACD
如何使用MACD
As a versatile trading tool that can reveal price momentum, the MACD is also useful in the identification of price trend and direction. The MACD indicator has enough strength to stand alone, but its predictive function is not absolute. Used with another indicator, the MACD can really ramp up the trader's advantage. (Learn more about momentum trading in Momentum Trading With Discipline.)
If a trader needs to determine trend strength and direction of a stock, overlaying its moving average lines onto the MACD histogram is very useful. The MACD can also be viewed as a histogram alone. (Learn more in An Introduction To The MACD Histogram.)
MACD Calculation
如何计算MACD
To bring in this oscillating indicator that fluctuates above and below zero, a simple MACD calculation is required. By subtracting the 26-day exponential moving average (EMA) of a security's price from a 12-day moving average of its price, an oscillating indicator value comes into play. Once a trigger line (the nine-day EMA) is added, the comparison of the two creates a trading picture. If the MACD value is higher than the nine-day EMA, then it is considered a bullish moving average crossover.
It's helpful to note that there are a few well-known ways to use the MACD:
Foremost is the watching for divergences or a crossover of the center line of the histogram; the MACD illustrates buy opportunities above zero and sell opportunities below.
Another is noting the moving average line crossovers and their relationship to the center line. (For more, see Trading The MACD Divergence.)
Identifying and Integrating Bullish Crossovers
确认及综合使用金叉
To be able to establish how to integrate a bullish MACD crossover and a bullish stochastic crossover into a trend-confirmation strategy, the word "bullish" needs to be explained. In the simplest of terms, "bullish" refers to a strong signal for continuously rising prices. A bullish signal is what happens when a faster moving average crosses up over a slower moving average, creating market momentum and suggesting further price increases.
In the case of a bullish MACD, this will occur when the histogram value is above the equilibrium line, and also when the MACD line is of a greater value than the nine-day EMA, also called the "MACD signal line."
The stochastic's bullish divergence occurs when %K value passes the %D, confirming a likely price turnaround.
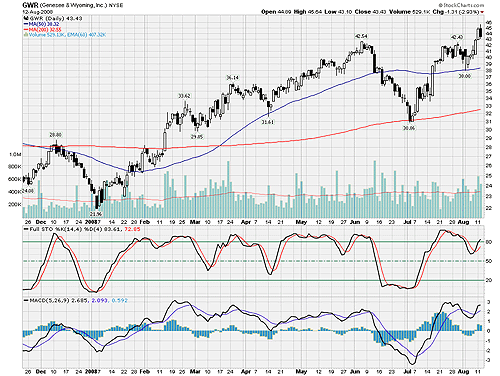
Crossovers In Action: Genesee & Wyoming Inc. (NYSE:GWR)
Below is an example of how and when to use a stochastic and MACD double cross.
Figure 1http://i.investopedia.com/inv/articles/site/AT-MACD.gif
图一http://i.investopedia.com/inv/articles/site/AT-MACD.gif
Source: StockCharts.com
图片来源:StockCharts.com
Note the green lines that show when these two indicators moved in sync and the near-perfect cross shown at the right-hand side of the chart.
You may notice that there are a couple of instances when the MACD and the stochastics are close to crossing simultaneously - January 2008, mid-March and mid-April, for example. It even looks like they did cross at the same time on a chart of this size, but when you take a closer look, you'll find that they did not actually cross within two days of each other, which was the criterion for setting up this scan. You may want to change the criteria so that you include crosses that occur within a wider time frame, so that you can capture moves like the ones shown below.
It's important to understand that changing the settings parameters can help produce a prolonged trendline, which helps a trader avoid a whipsaw. This is accomplished by using higher values in the interval/time-period settings. This is commonly referred to as "smoothing things out." Active traders, of course, use much shorter time frames in their indicator settings and would reference a five-day chart instead of one with months or years of price history.
The Strategy
双金叉交易策略
First, look for the bullish crossovers to occur within two days of each other. Keep in mind that when applying the stochastic and MACD double-cross strategy, ideally the crossover occurs below the 50 line on the stochastic to catch a longer price move. And preferably, you want the histogram value to be or move higher than zero within two days of placing your trade.
Also note that the MACD must cross slightly after the stochastic, as the alternative could create a false indication of the price trend or place you in sideways trend.
Finally, it is safer to trade stocks that are trading above their 200-day moving averages, but it is not an absolute necessity.
The Advantage
双金叉策略的优势
This strategy gives traders an opportunity to hold out for a better entry point on uptrending stock or to be surer that any downtrend is truly reversing itself when bottom-fishing for long-term holds. This strategy can be turned into a scan where charting software permits.
The Disadvantage
双金叉策略的缺陷
With every advantage that any strategy presents, there is always a disadvantage to the technique. Because the stock generally takes a longer time to line up in the best buying position, the actual trading of the stock occurs less frequently, so you may need a larger basket of stocks to watch.
Trick of the Trade
双金叉策略的交易窍门
The stochastic and MACD double cross allows for the trader to change the intervals, finding optimal and consistent entry points. This way it can be adjusted for the needs of both active traders and investors. Experiment with both indicator intervals and you will see how the crossovers will line up differently, and then choose the number of days that work best for your trading style. You may also want to add an RSI indicator into the mix, just for fun. (Read Ride The RSI Rollercoaster for more on this indicator.)
Conclusion
结论
Separately, the stochastic oscillator and MACD function on different technical premises and work alone. Compared to the stochastic, which ignores market jolts, the MACD is a more reliable option as a sole trading indicator. However, just like two heads, two indicators are usually better than one! The stochastic and MACD are an ideal pairing and can provide for an enhanced and more effective trading experience.
For further reading on using the stochastic oscillator and MACD together, see Combined Forces Power Snap Strategy.
![]() 喜欢
喜欢
0
![]() 赠金笔
赠金笔